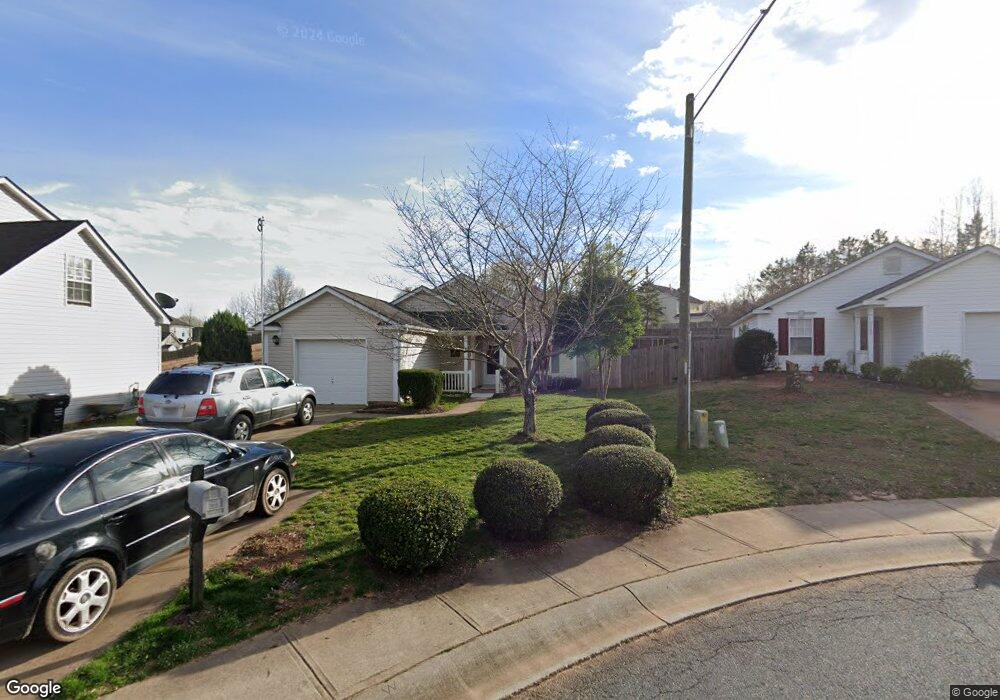
2885 Signal Ct SW Concord, NC 28025
Estimated Value: $253,000 - $275,000
3
Beds
2
Baths
1,250
Sq Ft
$214/Sq Ft
Est. Value
About This Home
This home is located at 2885 Signal Ct SW, Concord, NC 28025 and is currently estimated at $267,118, approximately $213 per square foot. 2885 Signal Ct SW is a home located in Cabarrus County with nearby schools including Rocky River Elementary School, J.N. Fries Middle School, and Branch Christian Academy.
Ownership History
Date
Name
Owned For
Owner Type
Purchase Details
Closed on
Jul 12, 2016
Sold by
Cerda Marjorie Ann and Cerda Calvin Pearce
Bought by
Eudy Joelene N and Eudy Wayne C
Current Estimated Value
Home Financials for this Owner
Home Financials are based on the most recent Mortgage that was taken out on this home.
Original Mortgage
$118,808
Outstanding Balance
$96,460
Interest Rate
4.12%
Mortgage Type
FHA
Estimated Equity
$170,658
Purchase Details
Closed on
Aug 29, 2002
Sold by
Beazer Homes Corp
Bought by
Cerda Calvin
Home Financials for this Owner
Home Financials are based on the most recent Mortgage that was taken out on this home.
Original Mortgage
$114,433
Interest Rate
6.49%
Mortgage Type
FHA
Create a Home Valuation Report for This Property
The Home Valuation Report is an in-depth analysis detailing your home's value as well as a comparison with similar homes in the area
Home Values in the Area
Average Home Value in this Area
Purchase History
| Date | Buyer | Sale Price | Title Company |
|---|---|---|---|
| Eudy Joelene N | $121,000 | None Available | |
| Cerda Calvin | $119,000 | -- |
Source: Public Records
Mortgage History
| Date | Status | Borrower | Loan Amount |
|---|---|---|---|
| Open | Eudy Joelene N | $118,808 | |
| Previous Owner | Cerda Calvin | $114,433 |
Source: Public Records
Tax History Compared to Growth
Tax History
| Year | Tax Paid | Tax Assessment Tax Assessment Total Assessment is a certain percentage of the fair market value that is determined by local assessors to be the total taxable value of land and additions on the property. | Land | Improvement |
|---|---|---|---|---|
| 2025 | $2,650 | $266,070 | $65,000 | $201,070 |
| 2024 | $2,650 | $266,070 | $65,000 | $201,070 |
| 2023 | $1,862 | $152,590 | $34,000 | $118,590 |
| 2022 | $1,862 | $152,590 | $34,000 | $118,590 |
| 2021 | $1,862 | $152,590 | $34,000 | $118,590 |
| 2020 | $1,862 | $152,590 | $34,000 | $118,590 |
| 2019 | $1,366 | $111,930 | $18,000 | $93,930 |
| 2018 | $1,343 | $111,930 | $18,000 | $93,930 |
| 2017 | $1,321 | $111,930 | $18,000 | $93,930 |
| 2016 | $469 | $94,960 | $18,000 | $76,960 |
| 2015 | $553 | $94,960 | $18,000 | $76,960 |
| 2014 | $553 | $94,960 | $18,000 | $76,960 |
Source: Public Records
Map
Nearby Homes
- 2893 Signal Ct SW
- 2824 Trestle Ct SW
- 609 Faith Dr SW Unit 1
- Lot #2 Faith Dr SW
- 809 Fargo Dr SW
- 758 Main St SW
- 782 Chalice St SW
- 84 Highland Ave SW
- 82 Highland Ave SW
- 3168 Sossamon Place
- 3073 Champion Ln SW
- 1067 Old Charlotte Rd
- 518 Viking Place SW
- 493 Debra Cir SW
- 1255 Old Charlotte Rd
- 933 Old Charlotte Rd
- 664 Jackson Terrace SW
- 668 Jackson Terrace SW
- 64 Robinson Dr SW
- 745 Old Charlotte Rd SW
- 2881 Signal Ct SW
- 2889 Signal Ct SW
- 2877 Signal Ct SW
- 559 Railway Place SW
- 2873 Signal Ct SW
- 555 Railway Place SW
- 2884 Signal Ct SW
- 2888 Signal Ct SW
- 2896 Signal Ct SW
- 541 Pullman St SW
- 2880 Signal Ct SW
- 2892 Signal Ct SW
- 2892 Signal Ct SW Unit 379
- 550 Railway Place SW
- 2876 Signal Ct SW
- 537 Pullman St SW
- 551 Railway Place SW
- 2872 Signal Ct SW
- 533 Pullman St SW
- 546 Railway Place SW