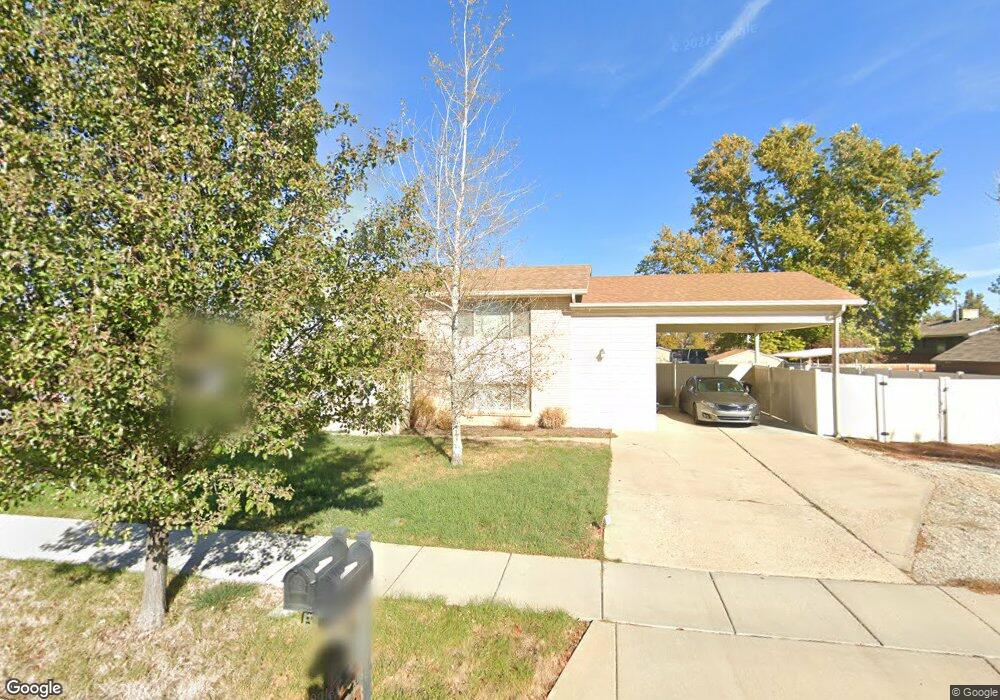
2886 W 1600 N Clearfield, UT 84015
Estimated Value: $374,000 - $414,927
4
Beds
2
Baths
1,764
Sq Ft
$227/Sq Ft
Est. Value
About This Home
This home is located at 2886 W 1600 N, Clearfield, UT 84015 and is currently estimated at $400,732, approximately $227 per square foot. 2886 W 1600 N is a home located in Davis County with nearby schools including West Clinton Elementary School, West Point Junior High School, and Syracuse High School.
Ownership History
Date
Name
Owned For
Owner Type
Purchase Details
Closed on
Feb 12, 2019
Sold by
Pobanz Jordan B and Roth Shayli
Bought by
Pobanz Jordan B and Pobanz Shayli Roth
Current Estimated Value
Home Financials for this Owner
Home Financials are based on the most recent Mortgage that was taken out on this home.
Original Mortgage
$223,250
Outstanding Balance
$195,882
Interest Rate
4.5%
Mortgage Type
New Conventional
Estimated Equity
$204,850
Purchase Details
Closed on
May 18, 2018
Sold by
Peterson Josh D
Bought by
Pobanz Jordan B and Roth Shayli
Home Financials for this Owner
Home Financials are based on the most recent Mortgage that was taken out on this home.
Original Mortgage
$223,100
Interest Rate
4.4%
Mortgage Type
New Conventional
Purchase Details
Closed on
Dec 9, 2013
Sold by
Atkinson Justin Cody
Bought by
Peterson Josh D
Home Financials for this Owner
Home Financials are based on the most recent Mortgage that was taken out on this home.
Original Mortgage
$119,200
Interest Rate
4.08%
Mortgage Type
New Conventional
Purchase Details
Closed on
Mar 4, 2013
Sold by
Secretary Of Hud
Bought by
Atkinson Justin Cody
Home Financials for this Owner
Home Financials are based on the most recent Mortgage that was taken out on this home.
Original Mortgage
$94,125
Interest Rate
3.4%
Mortgage Type
New Conventional
Purchase Details
Closed on
Aug 3, 2012
Sold by
Bank Of America Na
Bought by
Secretary Of Hud
Purchase Details
Closed on
Jul 10, 2012
Sold by
Carter Jodi
Bought by
Bank Of America Na
Purchase Details
Closed on
May 26, 2009
Sold by
Packer Kelly and Carter Jodi
Bought by
Carter Jodi
Purchase Details
Closed on
Apr 14, 2008
Sold by
Hsbc Mortgage Services Inc
Bought by
Packer Kelly and Carter Jodi
Home Financials for this Owner
Home Financials are based on the most recent Mortgage that was taken out on this home.
Original Mortgage
$142,661
Interest Rate
5.81%
Mortgage Type
FHA
Purchase Details
Closed on
Feb 12, 2008
Sold by
Beasley Steven W
Bought by
Hsbc Mortgage Services Inc
Purchase Details
Closed on
May 24, 2004
Sold by
Beasley Steven W and Beasley Roni D
Bought by
Beasley Steven W
Home Financials for this Owner
Home Financials are based on the most recent Mortgage that was taken out on this home.
Original Mortgage
$92,000
Interest Rate
6.6%
Mortgage Type
New Conventional
Create a Home Valuation Report for This Property
The Home Valuation Report is an in-depth analysis detailing your home's value as well as a comparison with similar homes in the area
Home Values in the Area
Average Home Value in this Area
Purchase History
| Date | Buyer | Sale Price | Title Company |
|---|---|---|---|
| Pobanz Jordan B | -- | Security Title Of | |
| Pobanz Jordan B | -- | Cottonwood Title | |
| Peterson Josh D | -- | Founders Title Co L | |
| Atkinson Justin Cody | -- | Cornerstone Title Ins | |
| Secretary Of Hud | -- | Guardian Title Ins Ag So | |
| Bank Of America Na | -- | Guardian Title Ins Ag | |
| Carter Jodi | -- | Cornerstone Title Ins | |
| Packer Kelly | -- | Backman Title Services | |
| Hsbc Mortgage Services Inc | $134,304 | Inwest Title Services Inc | |
| Beasley Steven W | -- | Inwest Title Services Inc |
Source: Public Records
Mortgage History
| Date | Status | Borrower | Loan Amount |
|---|---|---|---|
| Open | Pobanz Jordan B | $223,250 | |
| Closed | Pobanz Jordan B | $223,100 | |
| Previous Owner | Peterson Josh D | $119,200 | |
| Previous Owner | Atkinson Justin Cody | $94,125 | |
| Previous Owner | Packer Kelly | $142,661 | |
| Previous Owner | Beasley Steven W | $92,000 | |
| Closed | Beasley Steven W | $23,000 |
Source: Public Records
Tax History Compared to Growth
Tax History
| Year | Tax Paid | Tax Assessment Tax Assessment Total Assessment is a certain percentage of the fair market value that is determined by local assessors to be the total taxable value of land and additions on the property. | Land | Improvement |
|---|---|---|---|---|
| 2025 | $2,013 | $193,600 | $86,082 | $107,518 |
| 2024 | $1,969 | $190,300 | $95,052 | $95,248 |
| 2023 | $1,784 | $319,000 | $107,391 | $211,609 |
| 2022 | $1,896 | $187,550 | $66,619 | $120,931 |
| 2021 | $1,758 | $258,000 | $81,834 | $176,166 |
| 2020 | $1,528 | $222,000 | $68,719 | $153,281 |
| 2019 | $1,480 | $210,000 | $81,823 | $128,177 |
| 2018 | $1,320 | $184,000 | $69,311 | $114,689 |
| 2016 | $1,157 | $83,325 | $26,817 | $56,508 |
| 2015 | $1,115 | $76,285 | $26,817 | $49,468 |
| 2014 | $1,059 | $73,601 | $26,817 | $46,784 |
| 2013 | -- | $69,742 | $25,230 | $44,512 |
Source: Public Records
Map
Nearby Homes
- 3941 W 1800 N
- 2642 W 1500 N
- 1648 N 2615 W
- 2921 W 1300 N
- 1958 N 2750 W
- 3168 W 1300 N
- 1509 N 2475 W
- 1449 N 2475 W
- 1251 N 2525 W
- 2413 N Eurasian Crane Rd
- 1458 N 2400 W
- 2617 N 2080 W Unit 176
- 2371 W 1300 N
- 2816 W 960 N
- 2259 W 1800 N
- Linden Plan at
- Sycamore Plan at
- 1694 N 2225 W
- 3648 W 900 N Unit 207
- 3656 W 1800 N