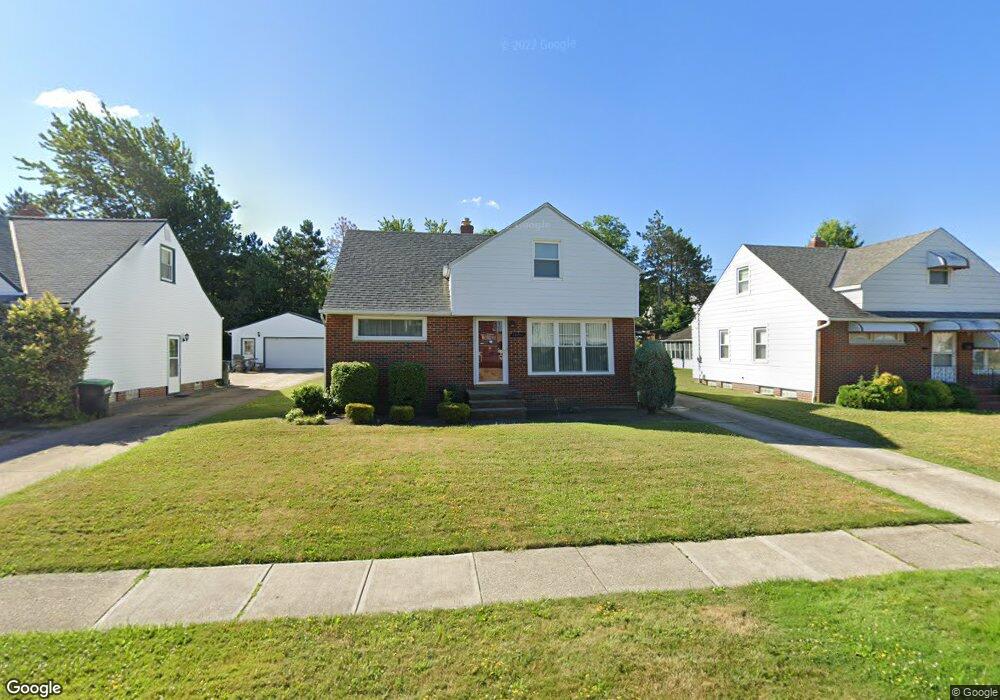
28866 Hazel Ave Wickliffe, OH 44092
Estimated Value: $175,898 - $192,000
4
Beds
2
Baths
867
Sq Ft
$214/Sq Ft
Est. Value
About This Home
This home is located at 28866 Hazel Ave, Wickliffe, OH 44092 and is currently estimated at $185,725, approximately $214 per square foot. 28866 Hazel Ave is a home located in Lake County with nearby schools including Wickliffe Elementary School, Wickliffe Middle School, and Wickliffe High School.
Ownership History
Date
Name
Owned For
Owner Type
Purchase Details
Closed on
May 19, 2005
Sold by
Arrigo Mark W
Bought by
Canterbury Charles E
Current Estimated Value
Home Financials for this Owner
Home Financials are based on the most recent Mortgage that was taken out on this home.
Original Mortgage
$112,800
Outstanding Balance
$55,439
Interest Rate
5.25%
Mortgage Type
Purchase Money Mortgage
Estimated Equity
$130,286
Purchase Details
Closed on
Dec 2, 2002
Sold by
Rosneck Vera K Trustee
Bought by
Arrigo Mark W
Home Financials for this Owner
Home Financials are based on the most recent Mortgage that was taken out on this home.
Original Mortgage
$92,700
Interest Rate
6.22%
Purchase Details
Closed on
Mar 9, 1998
Sold by
Rosneck Vera K and Rosneck Vera Kathleen
Bought by
Rosneck Vera K
Purchase Details
Closed on
Jan 1, 1990
Bought by
Rosneck Vera K
Create a Home Valuation Report for This Property
The Home Valuation Report is an in-depth analysis detailing your home's value as well as a comparison with similar homes in the area
Home Values in the Area
Average Home Value in this Area
Purchase History
| Date | Buyer | Sale Price | Title Company |
|---|---|---|---|
| Canterbury Charles E | $141,000 | Affinity Title | |
| Arrigo Mark W | $92,700 | Precise Title & Escrow Agenc | |
| Rosneck Vera K | -- | General Title | |
| Rosneck Vera K | -- | -- |
Source: Public Records
Mortgage History
| Date | Status | Borrower | Loan Amount |
|---|---|---|---|
| Open | Canterbury Charles E | $112,800 | |
| Previous Owner | Arrigo Mark W | $92,700 | |
| Closed | Canterbury Charles E | $28,200 |
Source: Public Records
Tax History
| Year | Tax Paid | Tax Assessment Tax Assessment Total Assessment is a certain percentage of the fair market value that is determined by local assessors to be the total taxable value of land and additions on the property. | Land | Improvement |
|---|---|---|---|---|
| 2025 | $1,301 | $55,480 | $15,110 | $40,370 |
| 2024 | $1,441 | $55,480 | $15,110 | $40,370 |
| 2023 | $1,441 | $36,770 | $12,780 | $23,990 |
| 2022 | $2,638 | $36,770 | $12,780 | $23,990 |
| 2021 | $2,649 | $36,770 | $12,780 | $23,990 |
| 2020 | $2,555 | $30,140 | $10,470 | $19,670 |
| 2019 | $2,554 | $30,140 | $10,470 | $19,670 |
| 2018 | $2,203 | $31,220 | $12,040 | $19,180 |
| 2017 | $2,198 | $31,220 | $12,040 | $19,180 |
| 2016 | $2,188 | $31,220 | $12,040 | $19,180 |
| 2015 | $2,149 | $31,220 | $12,040 | $19,180 |
| 2014 | $1,893 | $31,220 | $12,040 | $19,180 |
| 2013 | $1,892 | $31,220 | $12,040 | $19,180 |
Source: Public Records
Map
Nearby Homes
- 28756 Hazel Ave
- 28900 Euclid Ave
- 1354 Craneing Rd
- 0 Green Ridge Dr
- 2715 Cabin Dr
- 1525 Old School Way
- 29315 Nehls Park Dr
- 1670 Hillandale Dr
- 27701 Mills Ave Unit 2G
- 1540 E 298th St
- 1526 E 298th St
- 815 E 272nd St
- 29136 Norman Ave
- 730 Hemlock Dr
- V/L 39 Chardon Rd
- 670 Hemlock Dr
- 2745 Rockefeller Rd
- 953 Bryn Mawr Ave
- 597 Hemlock Dr
- 591 Hemlock Dr
- 28856 Hazel Ave
- 28876 Hazel Ave
- 28846 Hazel Ave
- 28836 Hazel Ave
- 28871 Coulby Ct
- 28855 Coulby Ct
- 28865 Hazel Ave
- 28855 Hazel Ave
- 28875 Hazel Ave
- 28885 Coulby Ct
- 28845 Hazel Ave
- 28835 Coulby Ct
- 28885 Hazel Ave
- 28826 Hazel Ave
- 28904 Hazel Ave
- 28835 Hazel Ave
- 28829 Coulby Ct
- 1795 E 289th St
- 28816 Hazel Ave
- 28914 Hazel Ave
Your Personal Tour Guide
Ask me questions while you tour the home.