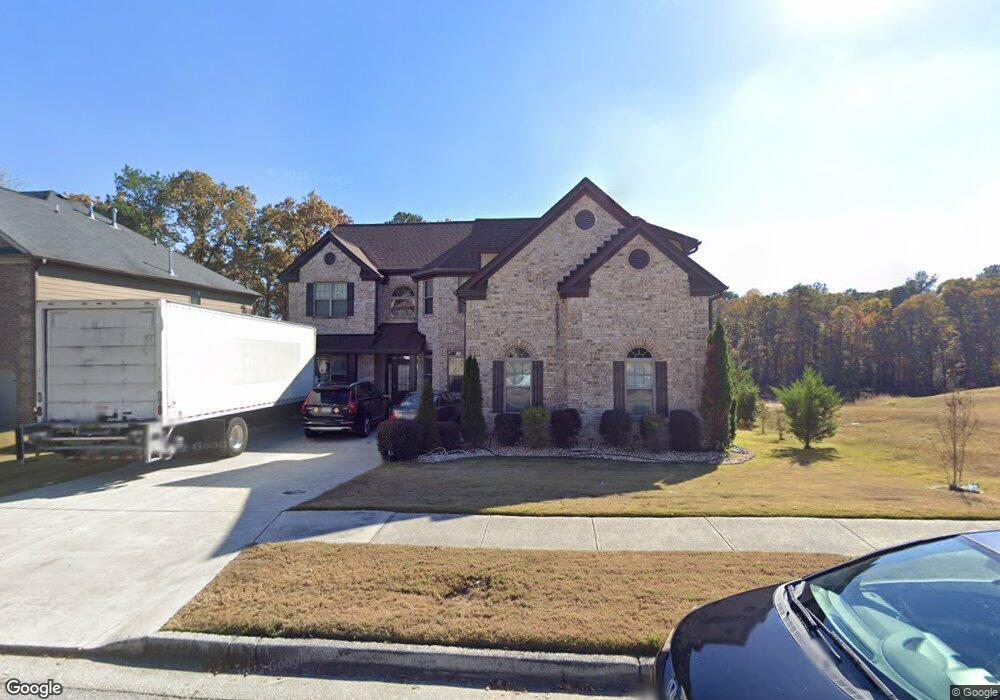
2887 Austin Common Dr Unit LOT 14 Dacula, GA 30019
Estimated Value: $510,000 - $587,000
5
Beds
4
Baths
4,232
Sq Ft
$129/Sq Ft
Est. Value
About This Home
This home is located at 2887 Austin Common Dr Unit LOT 14, Dacula, GA 30019 and is currently estimated at $544,138, approximately $128 per square foot. 2887 Austin Common Dr Unit LOT 14 is a home located in Gwinnett County with nearby schools including Harbins Elementary School, McConnell Middle School, and Archer High School.
Ownership History
Date
Name
Owned For
Owner Type
Purchase Details
Closed on
Feb 3, 2021
Sold by
Atobrah Florence
Bought by
Atobrah Florence and Atobrah Alex
Current Estimated Value
Home Financials for this Owner
Home Financials are based on the most recent Mortgage that was taken out on this home.
Original Mortgage
$418,950
Outstanding Balance
$372,655
Interest Rate
2.65%
Mortgage Type
New Conventional
Estimated Equity
$171,483
Purchase Details
Closed on
Feb 7, 2014
Sold by
Jefferson Homes Inc
Bought by
Hagans Cordian M and Hagans Shawna M
Home Financials for this Owner
Home Financials are based on the most recent Mortgage that was taken out on this home.
Original Mortgage
$299,704
Interest Rate
4.37%
Mortgage Type
FHA
Purchase Details
Closed on
Jul 3, 2013
Sold by
Austin Commons Holdings Ll
Bought by
Jefferson Homes Inc
Create a Home Valuation Report for This Property
The Home Valuation Report is an in-depth analysis detailing your home's value as well as a comparison with similar homes in the area
Home Values in the Area
Average Home Value in this Area
Purchase History
| Date | Buyer | Sale Price | Title Company |
|---|---|---|---|
| Atobrah Florence | -- | -- | |
| Atobrah Florence | $441,000 | -- | |
| Hagans Cordian M | $305,246 | -- | |
| Jefferson Homes Inc | $285,000 | -- |
Source: Public Records
Mortgage History
| Date | Status | Borrower | Loan Amount |
|---|---|---|---|
| Open | Atobrah Florence | $418,950 | |
| Closed | Atobrah Florence | $418,950 | |
| Previous Owner | Hagans Cordian M | $299,704 |
Source: Public Records
Tax History Compared to Growth
Tax History
| Year | Tax Paid | Tax Assessment Tax Assessment Total Assessment is a certain percentage of the fair market value that is determined by local assessors to be the total taxable value of land and additions on the property. | Land | Improvement |
|---|---|---|---|---|
| 2025 | $6,795 | $227,880 | $36,000 | $191,880 |
| 2024 | $6,239 | $192,840 | $36,000 | $156,840 |
| 2023 | $6,239 | $210,360 | $38,000 | $172,360 |
| 2022 | $5,574 | $162,720 | $31,600 | $131,120 |
| 2021 | $5,383 | $139,160 | $28,000 | $111,160 |
| 2020 | $5,067 | $129,560 | $24,000 | $105,560 |
| 2019 | $4,880 | $129,560 | $24,000 | $105,560 |
| 2018 | $4,631 | $122,240 | $21,600 | $100,640 |
| 2016 | $4,274 | $111,600 | $16,000 | $95,600 |
| 2015 | $4,296 | $111,600 | $16,000 | $95,600 |
| 2014 | -- | $104,400 | $16,000 | $88,400 |
Source: Public Records
Map
Nearby Homes
- 2040 Browning Bend Ct
- 2328 Austin Common Way
- 2704 Olivine Dr
- 1961 Vidalia Ct
- 837 Porches Way
- 1860 Browning Bend Ct
- 2967 Dolostone Way
- 2705 Luke Edwards Rd
- 1700 Cobblefield Cir
- 1899 Redfern Rd
- 1741 Cobblefield Cir
- 1781 Cobblefield Cir
- 1941 Cobblefield Cir
- 2694 Palm Creek Ct
- 2860 Windsor Knoll Dr
- 2790 Alcovy River View
- 1790 Alcovy River Dr
- 2506 Sky Valley Dr
- 1575 River Run Ln
- 1730 Alcovy River Dr
- 2887 Austin Common Dr
- 2897 Austin Commons Dr
- 2897 Austin Common Dr Unit LOT 15
- 2907 Austin Common Dr
- 2907 Austin Common Dr Unit 16
- 2886 Austin Common Dr Unit 22
- 2886 Austin Common Dr
- 2867 Austin Common Dr Unit LOT 13
- 2867 Austin Common Dr
- 2896 Austin Common Dr Unit 21
- 2896 Austin Common Dr
- 2836 Austin Common Dr Unit LOT 23
- 2836 Austin Common Dr
- 2917 Austin Commons Dr
- 2917 Austin Common Dr
- 2917 Austin Common Dr Unit LOT 17
- 2826 Austin Common Dr Unit 24
- 2826 Austin Common Dr
- 2916 Austin Common Dr Unit 20
- 2857 Austin Common Dr