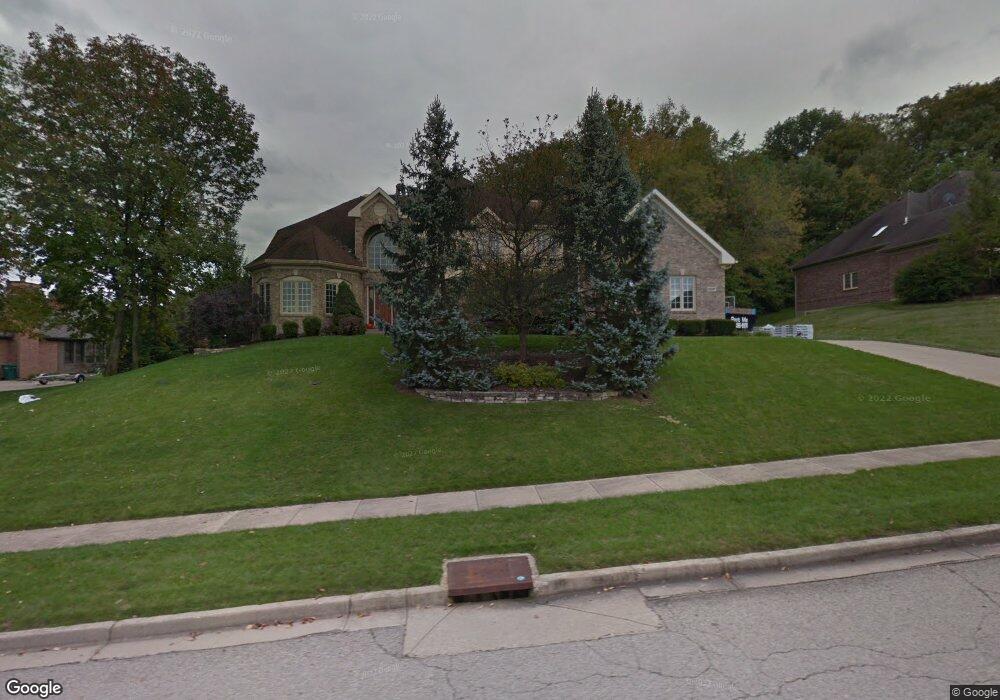
2887 Stone Mill Ct Beavercreek, OH 45434
Estimated Value: $567,797 - $670,000
5
Beds
6
Baths
3,473
Sq Ft
$181/Sq Ft
Est. Value
About This Home
This home is located at 2887 Stone Mill Ct, Beavercreek, OH 45434 and is currently estimated at $630,199, approximately $181 per square foot. 2887 Stone Mill Ct is a home located in Greene County with nearby schools including Valley Elementary School, Herman K Ankeney Middle School, and Beavercreek High School.
Ownership History
Date
Name
Owned For
Owner Type
Purchase Details
Closed on
Jul 2, 2015
Sold by
Haines Christopher B and Haines Rachael A
Bought by
Craw Stefan R and Craw Nicole L
Current Estimated Value
Home Financials for this Owner
Home Financials are based on the most recent Mortgage that was taken out on this home.
Original Mortgage
$251,000
Outstanding Balance
$195,715
Interest Rate
3.86%
Mortgage Type
New Conventional
Estimated Equity
$434,484
Purchase Details
Closed on
Sep 19, 2008
Sold by
Primacy Closing Corporation
Bought by
Haines Christopher B and Haines Rachael A
Home Financials for this Owner
Home Financials are based on the most recent Mortgage that was taken out on this home.
Original Mortgage
$264,000
Interest Rate
4.85%
Mortgage Type
Purchase Money Mortgage
Purchase Details
Closed on
May 29, 2008
Sold by
Bhagat Wilbur W and Bhagat Daksha
Bought by
Primary Closing Corporation
Create a Home Valuation Report for This Property
The Home Valuation Report is an in-depth analysis detailing your home's value as well as a comparison with similar homes in the area
Home Values in the Area
Average Home Value in this Area
Purchase History
| Date | Buyer | Sale Price | Title Company |
|---|---|---|---|
| Craw Stefan R | $335,000 | Attorney | |
| Haines Christopher B | $330,000 | Attorney | |
| Primary Closing Corporation | $380,800 | Attorney |
Source: Public Records
Mortgage History
| Date | Status | Borrower | Loan Amount |
|---|---|---|---|
| Open | Craw Stefan R | $251,000 | |
| Previous Owner | Haines Christopher B | $264,000 |
Source: Public Records
Tax History Compared to Growth
Tax History
| Year | Tax Paid | Tax Assessment Tax Assessment Total Assessment is a certain percentage of the fair market value that is determined by local assessors to be the total taxable value of land and additions on the property. | Land | Improvement |
|---|---|---|---|---|
| 2024 | $10,119 | $154,990 | $25,550 | $129,440 |
| 2023 | $10,119 | $154,990 | $25,550 | $129,440 |
| 2022 | $9,631 | $130,230 | $25,550 | $104,680 |
| 2021 | $9,436 | $130,230 | $25,550 | $104,680 |
| 2020 | $9,507 | $130,230 | $25,550 | $104,680 |
| 2019 | $9,917 | $124,000 | $27,390 | $96,610 |
| 2018 | $8,752 | $124,000 | $27,390 | $96,610 |
| 2017 | $9,484 | $124,000 | $27,390 | $96,610 |
| 2016 | $9,033 | $123,980 | $27,390 | $96,590 |
| 2015 | $9,193 | $123,980 | $27,390 | $96,590 |
| 2014 | $9,059 | $123,980 | $27,390 | $96,590 |
Source: Public Records
Map
Nearby Homes
- 2940 Stonewall Dr
- 337 Honey Jane Dr
- 539 Goldfinch Dr Unit 135
- 539 Goldfinch Dr
- 624 Goldfinch Dr Unit 100
- 2816 Blue Jay Ct Unit 72
- 2915 Sky Crossing Dr Unit 63
- 2905 Sky Crossing Dr Unit 61
- 624 Goldfinch Dr
- 2905 Sky Crossing Dr
- 632 Goldfinch Dr
- 620 Goldfinch Dr
- 2915 Sky Crossing Dr
- 2816 Blue Jay Ct
- Nicholas Plan at Sky Crossing
- Ainsley II Plan at Sky Crossing
- Inglewood Plan at Sky Crossing
- Cheswicke Plan at Sky Crossing
- Hampton Plan at Sky Crossing
- Nicholas I Plan at Sky Crossing
- 2897 Stone Mill Ct
- 2877 Stone Mill Ct
- 2862 Ash Ridge Dr
- 2874 Ash Ridge Dr
- 2858 Ash Ridge Dr
- 2892 Stone Mill Ct
- 2905 Stone Mill Ct
- 2863 Stone Mill Ct
- 2900 Stone Mill Ct
- 2882 Stone Mill Ct
- 2852 Ash Ridge Dr
- 611 Southern Belle Blvd
- 2912 Stone Mill Ct
- 2855 Ash Ridge Dr
- 2849 Stone Mill Ct
- 2880 Ash Ridge Dr
- 2915 Stone Mill Ct
- 2911 Stonewall Dr
- 2919 Stonewall Dr
- 2870 Maginn Dr