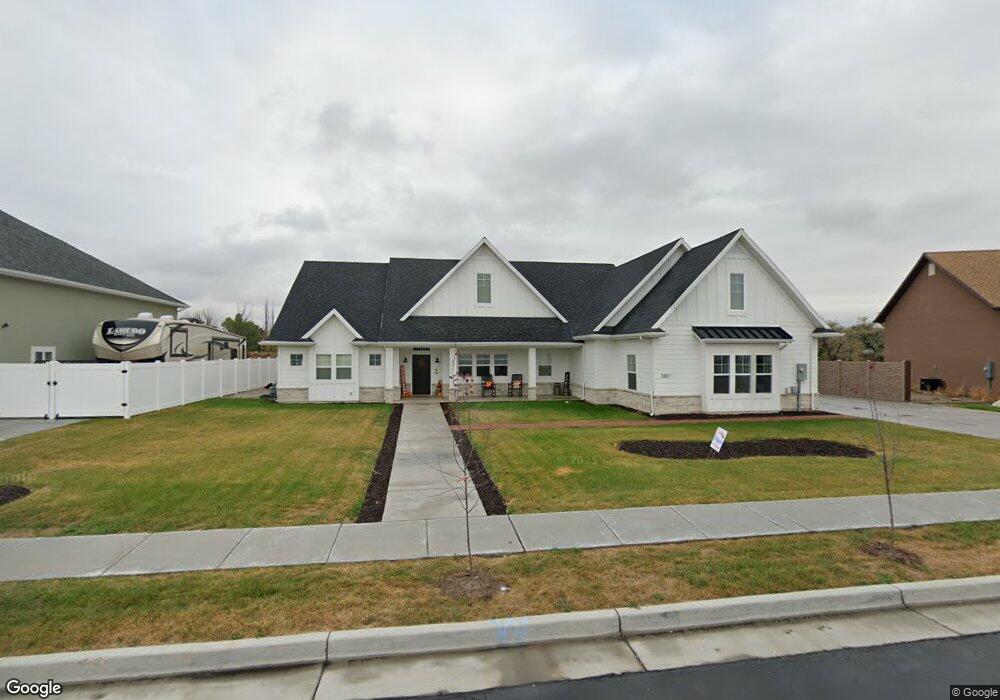
2887 W 3325 N Farr West, UT 84404
Estimated Value: $677,000 - $707,457
4
Beds
3
Baths
3,044
Sq Ft
$229/Sq Ft
Est. Value
About This Home
This home is located at 2887 W 3325 N, Farr West, UT 84404 and is currently estimated at $696,364, approximately $228 per square foot. 2887 W 3325 N is a home located in Weber County with nearby schools including Wahlquist Junior High School and Fremont High School.
Ownership History
Date
Name
Owned For
Owner Type
Purchase Details
Closed on
Oct 10, 2025
Sold by
Waikart Donna and Waikart Frank C
Bought by
Frank And Donna Waikart Revocable Living Trus and Waikart
Current Estimated Value
Purchase Details
Closed on
Oct 15, 2020
Sold by
Larsen Dale
Bought by
Walkart Donna and Waikart Frank C
Home Financials for this Owner
Home Financials are based on the most recent Mortgage that was taken out on this home.
Original Mortgage
$357,000
Interest Rate
2.4%
Mortgage Type
New Conventional
Purchase Details
Closed on
Apr 4, 2019
Sold by
Cody Rhees Construction Inc
Bought by
Larsen Dale
Home Financials for this Owner
Home Financials are based on the most recent Mortgage that was taken out on this home.
Original Mortgage
$430,529
Interest Rate
4.3%
Mortgage Type
New Conventional
Purchase Details
Closed on
Jul 5, 2018
Sold by
Remuda Court Llc
Bought by
Cody Rhees Construction Inc
Home Financials for this Owner
Home Financials are based on the most recent Mortgage that was taken out on this home.
Original Mortgage
$347,100
Interest Rate
4.6%
Mortgage Type
Construction
Create a Home Valuation Report for This Property
The Home Valuation Report is an in-depth analysis detailing your home's value as well as a comparison with similar homes in the area
Home Values in the Area
Average Home Value in this Area
Purchase History
| Date | Buyer | Sale Price | Title Company |
|---|---|---|---|
| Frank And Donna Waikart Revocable Living Trus | -- | None Listed On Document | |
| Walkart Donna | -- | Investors Title Ins Agcy | |
| Larsen Dale | -- | Mountain View Title Ogden | |
| Larsen Dale | -- | Mountain View Title Ogden | |
| Cody Rhees Construction Inc | -- | Mountain View Title |
Source: Public Records
Mortgage History
| Date | Status | Borrower | Loan Amount |
|---|---|---|---|
| Previous Owner | Walkart Donna | $357,000 | |
| Previous Owner | Larsen Dale | $430,529 | |
| Previous Owner | Cody Rhees Construction Inc | $347,100 |
Source: Public Records
Tax History Compared to Growth
Tax History
| Year | Tax Paid | Tax Assessment Tax Assessment Total Assessment is a certain percentage of the fair market value that is determined by local assessors to be the total taxable value of land and additions on the property. | Land | Improvement |
|---|---|---|---|---|
| 2025 | $4,238 | $666,384 | $200,613 | $465,771 |
| 2024 | $4,314 | $360,249 | $110,323 | $249,926 |
| 2023 | $3,969 | $328,350 | $110,129 | $218,221 |
| 2022 | $4,288 | $371,800 | $99,267 | $272,533 |
| 2021 | $3,433 | $487,000 | $114,330 | $372,670 |
| 2020 | $3,158 | $406,000 | $114,330 | $291,670 |
| 2019 | $1,974 | $213,595 | $95,265 | $118,330 |
| 2018 | $1,320 | $80,374 | $80,374 | $0 |
| 2017 | $0 | $0 | $0 | $0 |
Source: Public Records
Map
Nearby Homes
- 3356 N 2900 W
- 2878 W North Plain City Rd
- 2830 W North Plain City Rd
- 3059 N 2825 W
- 3221 N 2875 W Unit 33
- 3209 N 2875 W Unit 34
- 3202 N 2875 W Unit 39
- 3524 N 3000 W
- 3190 N 2875 W Unit 38
- 3158 W North Plain City Rd
- 3261 2500 W
- 2417 W 3200 N
- 3274 2500 W
- 1158 3425 N Unit 212
- 3080 N 3325 W
- 3268 2425 W
- 3215 Saddlebrook Ln Unit 319
- 3320 W North Plain City Rd
- 3198 N 3475 W
- 2405 W 3200 N
- 2887 W 3325 N Unit 149RC
- 2877 W 3325 N
- 2877 W 3325 N Unit 150RC
- 2897 W 3325 N Unit 148RC
- 2880 W 3325 N
- 2880 W 3325 N Unit 163
- 3342 N 2900 W
- 3331 N 2900 W
- 2865 W 3325 N
- 2868 W 3325 N
- 2853 W 3325 N Unit 152
- 2853 W 3325 N
- 3343 N 2900 W
- 3348 N 2900 W
- 3363 N 2900 W Unit 144
- 3363 N 2900 W
- 2854 W 3325 N
- 3353 N 2900 W
- 2841 W 3325 N Unit 153
- 2841 W 3325 N