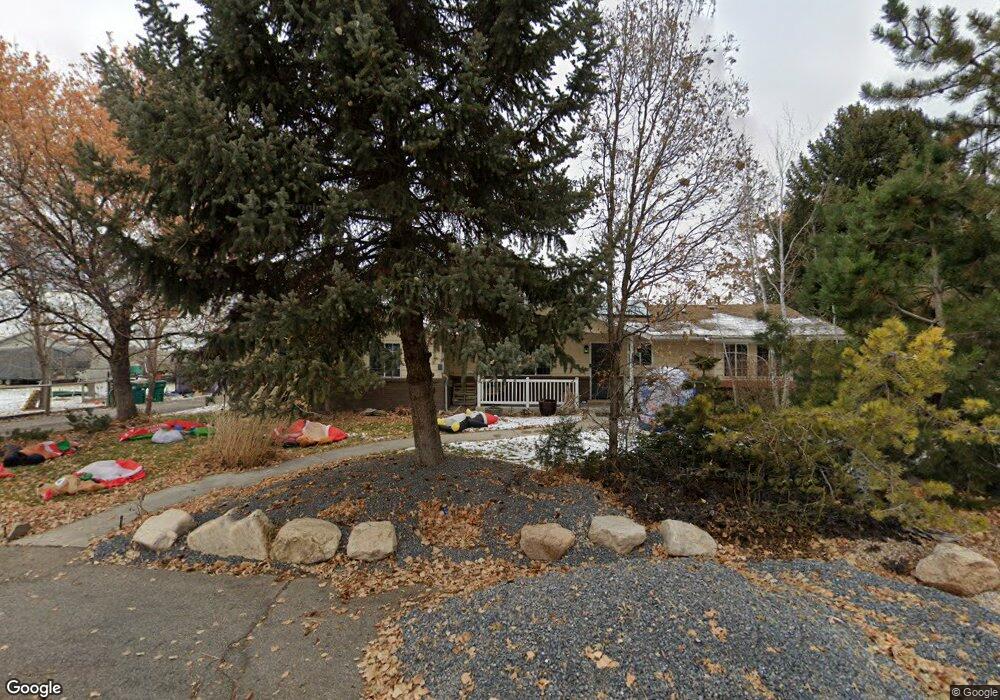
2888 W 3775 S West Haven, UT 84401
Estimated Value: $593,000 - $651,000
3
Beds
2
Baths
1,767
Sq Ft
$347/Sq Ft
Est. Value
About This Home
This home is located at 2888 W 3775 S, West Haven, UT 84401 and is currently estimated at $613,272, approximately $347 per square foot. 2888 W 3775 S is a home located in Weber County with nearby schools including Kanesville Elementary School, Rocky Mountain Junior High School, and Fremont High School.
Ownership History
Date
Name
Owned For
Owner Type
Purchase Details
Closed on
Mar 22, 2023
Sold by
Vigil Perry
Bought by
Perry And Elizabeth Vigil Living Trust
Current Estimated Value
Purchase Details
Closed on
Nov 27, 2019
Sold by
Vigil Perry and Vigil Elizabeth Marie
Bought by
Vigil Perry and Vigil Elizabeth Marie
Home Financials for this Owner
Home Financials are based on the most recent Mortgage that was taken out on this home.
Original Mortgage
$205,500
Interest Rate
3.6%
Mortgage Type
VA
Purchase Details
Closed on
Jul 24, 2008
Sold by
Meacham David R and Meacham Kristine J
Bought by
Vigil Perry
Home Financials for this Owner
Home Financials are based on the most recent Mortgage that was taken out on this home.
Original Mortgage
$279,000
Interest Rate
6.31%
Mortgage Type
VA
Create a Home Valuation Report for This Property
The Home Valuation Report is an in-depth analysis detailing your home's value as well as a comparison with similar homes in the area
Home Values in the Area
Average Home Value in this Area
Purchase History
| Date | Buyer | Sale Price | Title Company |
|---|---|---|---|
| Perry And Elizabeth Vigil Living Trust | -- | None Listed On Document | |
| Vigil Perry | -- | Closing Usa Llc | |
| Vigil Perry | -- | Lincoln Title Ins Agency |
Source: Public Records
Mortgage History
| Date | Status | Borrower | Loan Amount |
|---|---|---|---|
| Previous Owner | Vigil Perry | $205,500 | |
| Previous Owner | Vigil Perry | $279,000 |
Source: Public Records
Tax History Compared to Growth
Tax History
| Year | Tax Paid | Tax Assessment Tax Assessment Total Assessment is a certain percentage of the fair market value that is determined by local assessors to be the total taxable value of land and additions on the property. | Land | Improvement |
|---|---|---|---|---|
| 2025 | $856 | $548,186 | $171,446 | $376,740 |
| 2024 | $757 | $298,309 | $94,295 | $204,014 |
| 2023 | $675 | $313,853 | $94,280 | $219,573 |
| 2022 | $1,584 | $587,999 | $171,419 | $416,580 |
| 2021 | $1,030 | $478,000 | $95,913 | $382,087 |
| 2020 | $551 | $406,999 | $80,717 | $326,282 |
| 2019 | $482 | $381,001 | $72,146 | $308,855 |
| 2018 | $421 | $379,000 | $72,146 | $306,854 |
| 2017 | $377 | $303,000 | $63,543 | $239,457 |
| 2016 | $330 | $146,027 | $35,063 | $110,964 |
| 2015 | $295 | $145,477 | $35,063 | $110,414 |
| 2014 | $259 | $137,402 | $40,547 | $96,855 |
Source: Public Records
Map
Nearby Homes
- 3866 S 2970 W
- 3891 S 2940 W
- 3963 S 2925 W
- 2917 W 3970 S Unit 53
- 3721 S 3175 W
- 3639 S Macy Ln
- 3634 S Macy Ln
- 3114 S 3175 W Unit 21
- 3117 S 3175 W Unit 12
- 3111 S 3175 W Unit 11
- 3860 S Midland Dr Unit B97
- 3860 S Midland Dr Unit B59
- 3860 S Midland Dr Unit B 51
- 3604 S Macy Ln
- 3717 S 3250 W
- Buchanan | Lot 4025 Plan at Salt Point - Legacy
- Buchanan Model Home | Lot 0015 Plan at Salt Point - Legacy
- 3229 W 3855 S
- 3835 S 3250 W
- 3750 S Midland Dr