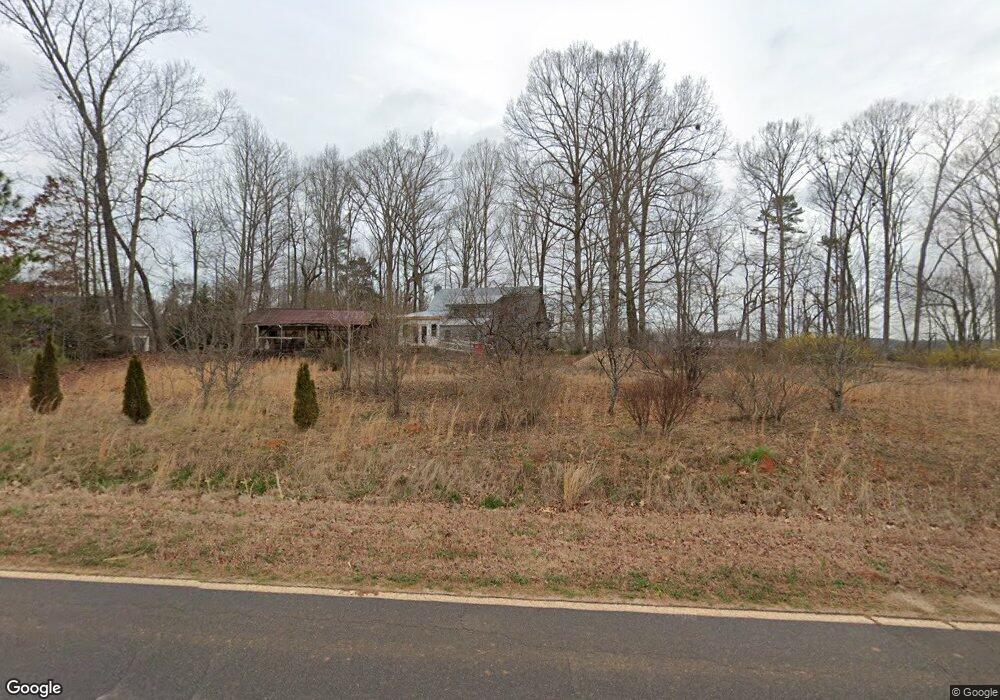
2889 Brockton Loop Jefferson, GA 30549
Estimated Value: $319,000 - $516,000
3
Beds
2
Baths
1,373
Sq Ft
$293/Sq Ft
Est. Value
About This Home
This home is located at 2889 Brockton Loop, Jefferson, GA 30549 and is currently estimated at $402,450, approximately $293 per square foot. 2889 Brockton Loop is a home located in Jackson County with nearby schools including South Jackson Elementary School, East Jackson Middle School, and East Jackson Comprehensive High School.
Ownership History
Date
Name
Owned For
Owner Type
Purchase Details
Closed on
Mar 4, 2010
Sold by
Gaddis Anthony P
Bought by
Lane Penelope D
Current Estimated Value
Home Financials for this Owner
Home Financials are based on the most recent Mortgage that was taken out on this home.
Original Mortgage
$110,204
Outstanding Balance
$71,704
Interest Rate
5.01%
Mortgage Type
New Conventional
Estimated Equity
$330,746
Purchase Details
Closed on
Mar 28, 2006
Sold by
Not Provided
Bought by
Lane Penelope D
Home Financials for this Owner
Home Financials are based on the most recent Mortgage that was taken out on this home.
Original Mortgage
$112,720
Interest Rate
7.75%
Mortgage Type
New Conventional
Purchase Details
Closed on
Apr 5, 2001
Sold by
Harris James
Bought by
Harris Jeffery J and Harris T
Create a Home Valuation Report for This Property
The Home Valuation Report is an in-depth analysis detailing your home's value as well as a comparison with similar homes in the area
Home Values in the Area
Average Home Value in this Area
Purchase History
| Date | Buyer | Sale Price | Title Company |
|---|---|---|---|
| Lane Penelope D | $108,000 | -- | |
| Lane Penelope D | $140,900 | -- | |
| Harris Jeffery J | -- | -- |
Source: Public Records
Mortgage History
| Date | Status | Borrower | Loan Amount |
|---|---|---|---|
| Open | Lane Penelope D | $110,204 | |
| Previous Owner | Lane Penelope D | $112,720 |
Source: Public Records
Tax History
| Year | Tax Paid | Tax Assessment Tax Assessment Total Assessment is a certain percentage of the fair market value that is determined by local assessors to be the total taxable value of land and additions on the property. | Land | Improvement |
|---|---|---|---|---|
| 2025 | $1,529 | $121,400 | $33,040 | $88,360 |
| 2024 | $1,529 | $121,400 | $33,040 | $88,360 |
| 2023 | $3,058 | $109,760 | $33,040 | $76,720 |
| 2022 | $2,021 | $71,320 | $11,240 | $60,080 |
| 2021 | $2,035 | $71,320 | $11,240 | $60,080 |
| 2020 | $1,833 | $59,040 | $11,240 | $47,800 |
| 2019 | $1,860 | $59,040 | $11,240 | $47,800 |
| 2018 | $1,849 | $57,920 | $11,240 | $46,680 |
| 2017 | $1,675 | $53,029 | $10,682 | $42,347 |
| 2016 | $1,684 | $53,029 | $10,682 | $42,347 |
| 2015 | $1,692 | $53,029 | $10,682 | $42,347 |
| 2014 | $1,608 | $50,122 | $10,682 | $39,440 |
| 2013 | -- | $52,667 | $11,244 | $41,423 |
Source: Public Records
Map
Nearby Homes
- 285 Trotters Way
- 4107 Jefferson River Rd
- 47 Emmaline Ln
- 246 Emmaline Ln
- 2B Curry Falls Trail Rd Unit 2B
- 4558 Jefferson River Rd
- 1123 Poppy Ln
- 176 Whitetail Trail
- 1601 Cedarwood Dr
- Lot 5 Stewart Loop
- Lot 4 Stewart Loop
- 0 Rita Ridge Unit LOT 4
- 0 Rita Ridge Unit LOT 3
- 0 Rita Ridge Unit LOT 7
- 0 Rita Ridge Unit Lot 8
- 0 Rita Ridge Unit LOT 2
- 0 Rita Ridge Unit LOT 9
- 0 Rita Ridge Unit LOT 6
- 0 Rita Ridge Unit LOT 10
- 0 Rita Ridge Unit LOT 5
- 2897 Brockton Loop
- 2791 Brockton Loop
- 2917 Brockton Loop
- 0 Heaven Cir
- 0 Heaven Cir Unit 8574954
- 0 Heaven Cir Unit 8312698
- 0 Heaven Cir Unit 7526140
- 0 Heaven Cir Unit 8502566
- 0 Heaven Cir Unit 8090567
- 2904 Brockton Loop
- 2751 Brockton Loop
- 2711 Brockton Loop
- 3037 Brockton Loop
- 3006 Brockton Loop
- 3008 Brockton Loop
- 2663 Brockton Loop
- 3084 Brockton Loop
- 00 Heaven Cir
- 2495 Brockton Loop
- 365 Heaven Cir
Your Personal Tour Guide
Ask me questions while you tour the home.