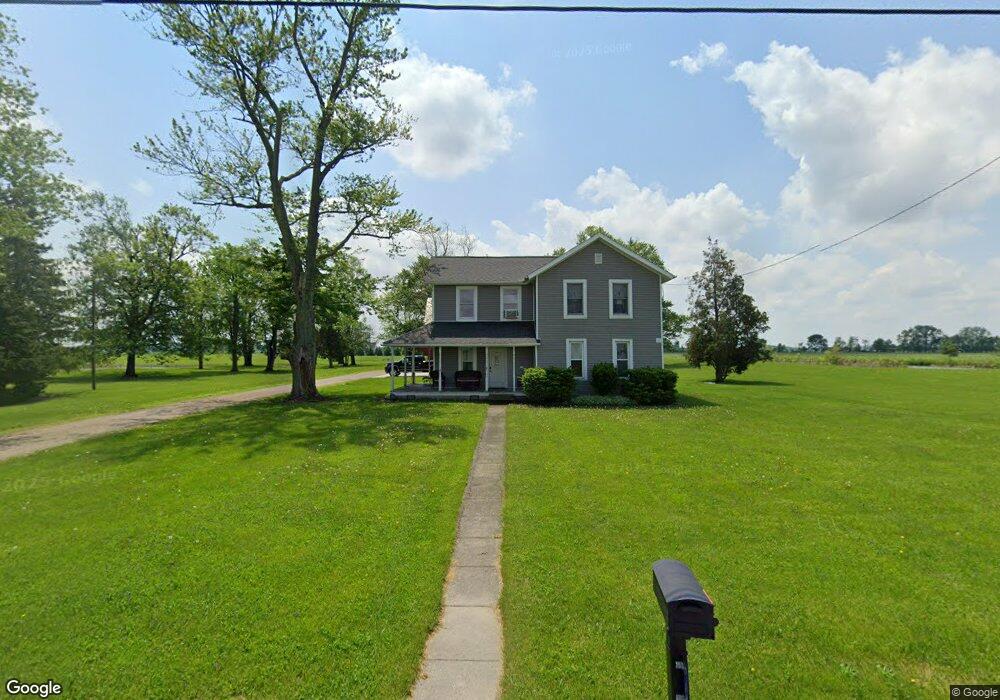
28896 Jewell Rd Defiance, OH 43512
Estimated Value: $194,000 - $287,000
3
Beds
2
Baths
2,114
Sq Ft
$111/Sq Ft
Est. Value
About This Home
This home is located at 28896 Jewell Rd, Defiance, OH 43512 and is currently estimated at $234,483, approximately $110 per square foot. 28896 Jewell Rd is a home located in Defiance County with nearby schools including Tinora Elementary School, Noble Elementary School, and Tinora Middle School.
Ownership History
Date
Name
Owned For
Owner Type
Purchase Details
Closed on
Oct 1, 2020
Sold by
Steffel Eric J
Bought by
Katafias David J
Current Estimated Value
Home Financials for this Owner
Home Financials are based on the most recent Mortgage that was taken out on this home.
Original Mortgage
$136,000
Outstanding Balance
$120,189
Interest Rate
2.8%
Mortgage Type
New Conventional
Estimated Equity
$114,294
Purchase Details
Closed on
Mar 28, 2005
Sold by
Westrick Andrew D and Westrick Amanda J
Bought by
Steffel Eric
Home Financials for this Owner
Home Financials are based on the most recent Mortgage that was taken out on this home.
Original Mortgage
$5,000
Interest Rate
5.71%
Mortgage Type
Credit Line Revolving
Purchase Details
Closed on
Jan 3, 2002
Bought by
Steffel Eric
Purchase Details
Closed on
Oct 1, 1990
Bought by
Steffel Eric
Create a Home Valuation Report for This Property
The Home Valuation Report is an in-depth analysis detailing your home's value as well as a comparison with similar homes in the area
Home Values in the Area
Average Home Value in this Area
Purchase History
| Date | Buyer | Sale Price | Title Company |
|---|---|---|---|
| Katafias David J | $170,000 | None Available | |
| Steffel Eric | -- | None Available | |
| Steffel Eric | $85,000 | -- | |
| Steffel Eric | $47,000 | -- |
Source: Public Records
Mortgage History
| Date | Status | Borrower | Loan Amount |
|---|---|---|---|
| Open | Katafias David J | $136,000 | |
| Previous Owner | Steffel Eric | $5,000 | |
| Previous Owner | Steffel Eric | $98,800 |
Source: Public Records
Tax History Compared to Growth
Tax History
| Year | Tax Paid | Tax Assessment Tax Assessment Total Assessment is a certain percentage of the fair market value that is determined by local assessors to be the total taxable value of land and additions on the property. | Land | Improvement |
|---|---|---|---|---|
| 2024 | $2,463 | $66,060 | $6,760 | $59,300 |
| 2023 | $2,346 | $66,060 | $6,760 | $59,300 |
| 2022 | $1,375 | $32,510 | $6,160 | $26,350 |
| 2021 | $1,375 | $32,510 | $6,160 | $26,350 |
| 2020 | $1,350 | $32,510 | $6,160 | $26,350 |
| 2019 | $1,232 | $30,610 | $6,060 | $24,550 |
| 2018 | $1,267 | $30,610 | $6,060 | $24,550 |
| 2017 | $1,117 | $30,604 | $6,055 | $24,549 |
| 2016 | $974 | $25,648 | $5,915 | $19,733 |
| 2015 | -- | $25,648 | $5,915 | $19,733 |
| 2014 | -- | $25,648 | $5,915 | $19,733 |
| 2013 | -- | $25,648 | $5,915 | $19,733 |
| 2012 | -- | $25,648 | $5,915 | $19,733 |
Source: Public Records
Map
Nearby Homes
- 27600 Jewell Rd
- 30260 Jewell Rd
- 6767 Independence Rd
- 407 W High St
- 26825 Behrens Rd
- 0 Domersville Rd
- 104 E High St
- 104 W High St
- 850 Deerwood Dr
- 846 Deerwood Dr
- 1275 Pinehurst Dr
- 1459 Deerwood Dr
- 1365 Heatherdowns Dr
- 679 Burning Tree Dr
- 673 Burning Tree Dr
- 1408 Heatherdowns Dr
- 655 Burning Tree Dr
- 649 Burning Tree Dr
- 29232 Coressel Rd
- 0 Carpenter Rd Unit 10001359
- 28936 Jewell Rd
- 29131 Jewell Rd
- 28565 Jewell Rd
- 28466 Jewell Rd
- 28487 Jewell Rd
- 28406 Jewell Rd
- 28388 Jewell Rd
- 28381 Jewell Rd
- 28364 Jewell Rd
- 29361 Jewell Rd
- 28332 Jewell Rd
- 28318 Jewell Rd
- 28321 Jewell Rd
- 28304 Jewell Rd
- 28289 Jewell Rd
- 28288 Jewell Rd
- 28274 Jewell Rd
- 28273 Jewell Rd
- 28261 Jewell
- 28254 Jewell Rd