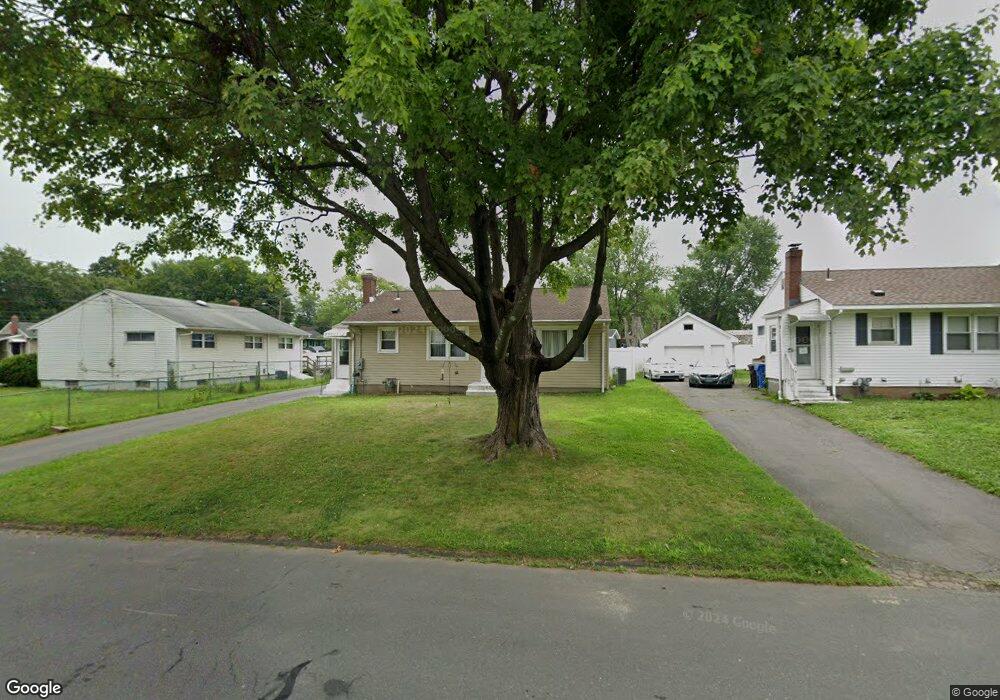
289 Bingham St New Britain, CT 06051
Estimated Value: $218,000 - $278,000
3
Beds
1
Bath
936
Sq Ft
$264/Sq Ft
Est. Value
About This Home
This home is located at 289 Bingham St, New Britain, CT 06051 and is currently estimated at $246,873, approximately $263 per square foot. 289 Bingham St is a home located in Hartford County with nearby schools including Slade Middle School, Raymond Hill School, and Mountain Laurel Sudbury School.
Ownership History
Date
Name
Owned For
Owner Type
Purchase Details
Closed on
Mar 1, 2010
Sold by
Gombotz Ronald
Bought by
Mendoza Carlos M and Mendoza Joy A
Current Estimated Value
Home Financials for this Owner
Home Financials are based on the most recent Mortgage that was taken out on this home.
Original Mortgage
$125,092
Outstanding Balance
$84,019
Interest Rate
5.25%
Mortgage Type
FHA
Estimated Equity
$162,854
Create a Home Valuation Report for This Property
The Home Valuation Report is an in-depth analysis detailing your home's value as well as a comparison with similar homes in the area
Home Values in the Area
Average Home Value in this Area
Purchase History
| Date | Buyer | Sale Price | Title Company |
|---|---|---|---|
| Mendoza Carlos M | $63,700 | -- | |
| Mendoza Carlos M | $63,700 | -- |
Source: Public Records
Mortgage History
| Date | Status | Borrower | Loan Amount |
|---|---|---|---|
| Open | Mendoza Carlos M | $125,092 |
Source: Public Records
Tax History Compared to Growth
Tax History
| Year | Tax Paid | Tax Assessment Tax Assessment Total Assessment is a certain percentage of the fair market value that is determined by local assessors to be the total taxable value of land and additions on the property. | Land | Improvement |
|---|---|---|---|---|
| 2025 | $4,155 | $106,050 | $42,210 | $63,840 |
| 2024 | $4,199 | $106,050 | $42,210 | $63,840 |
| 2023 | $4,060 | $106,050 | $42,210 | $63,840 |
| 2022 | $3,593 | $72,590 | $19,460 | $53,130 |
| 2021 | $3,593 | $72,590 | $19,460 | $53,130 |
| 2020 | $3,666 | $72,590 | $19,460 | $53,130 |
| 2019 | $3,666 | $72,590 | $19,460 | $53,130 |
| 2018 | $3,666 | $72,590 | $19,460 | $53,130 |
| 2017 | $3,524 | $69,790 | $19,460 | $50,330 |
| 2016 | $3,524 | $69,790 | $19,460 | $50,330 |
| 2015 | $3,420 | $69,790 | $19,460 | $50,330 |
| 2014 | $3,420 | $69,790 | $19,460 | $50,330 |
Source: Public Records
Map
Nearby Homes