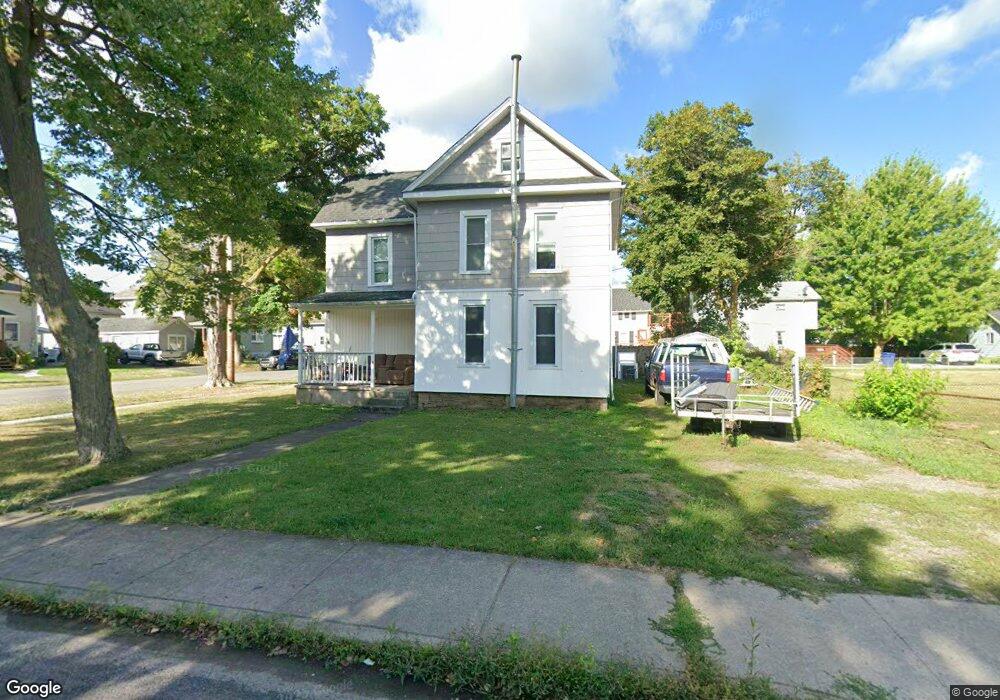
289 Church St Lockport, NY 14094
Estimated Value: $99,000 - $131,000
3
Beds
2
Baths
1,472
Sq Ft
$79/Sq Ft
Est. Value
About This Home
This home is located at 289 Church St, Lockport, NY 14094 and is currently estimated at $115,765, approximately $78 per square foot. 289 Church St is a home located in Niagara County with nearby schools including Aaron Mossell Junior High School, Lockport High School, and DeSales Catholic School.
Ownership History
Date
Name
Owned For
Owner Type
Purchase Details
Closed on
Dec 6, 2017
Sold by
Szpilewski Thomas A and Szpilewski Eugene
Bought by
Rutty Jesse A
Current Estimated Value
Home Financials for this Owner
Home Financials are based on the most recent Mortgage that was taken out on this home.
Original Mortgage
$22,000
Interest Rate
3.95%
Mortgage Type
Seller Take Back
Purchase Details
Closed on
Oct 21, 1998
Sold by
Brown Glenn D
Bought by
Szpilewski Eugene and Szpilewski Thomas A
Create a Home Valuation Report for This Property
The Home Valuation Report is an in-depth analysis detailing your home's value as well as a comparison with similar homes in the area
Home Values in the Area
Average Home Value in this Area
Purchase History
| Date | Buyer | Sale Price | Title Company |
|---|---|---|---|
| Rutty Jesse A | $42,000 | -- | |
| Szpilewski Eugene | $34,000 | -- |
Source: Public Records
Mortgage History
| Date | Status | Borrower | Loan Amount |
|---|---|---|---|
| Closed | Rutty Jesse A | $22,000 |
Source: Public Records
Tax History Compared to Growth
Tax History
| Year | Tax Paid | Tax Assessment Tax Assessment Total Assessment is a certain percentage of the fair market value that is determined by local assessors to be the total taxable value of land and additions on the property. | Land | Improvement |
|---|---|---|---|---|
| 2024 | $2,337 | $86,000 | $3,200 | $82,800 |
| 2023 | $2,321 | $83,000 | $3,200 | $79,800 |
| 2022 | $1,820 | $75,000 | $3,200 | $71,800 |
| 2021 | $1,857 | $47,100 | $3,900 | $43,200 |
| 2020 | $1,817 | $47,100 | $3,900 | $43,200 |
| 2019 | $407 | $47,100 | $3,900 | $43,200 |
| 2018 | $1,314 | $47,100 | $3,900 | $43,200 |
| 2017 | $1,309 | $47,100 | $3,900 | $43,200 |
| 2016 | $1,268 | $47,100 | $3,900 | $43,200 |
| 2015 | -- | $47,100 | $3,900 | $43,200 |
| 2014 | -- | $47,100 | $3,900 | $43,200 |
Source: Public Records
Map
Nearby Homes