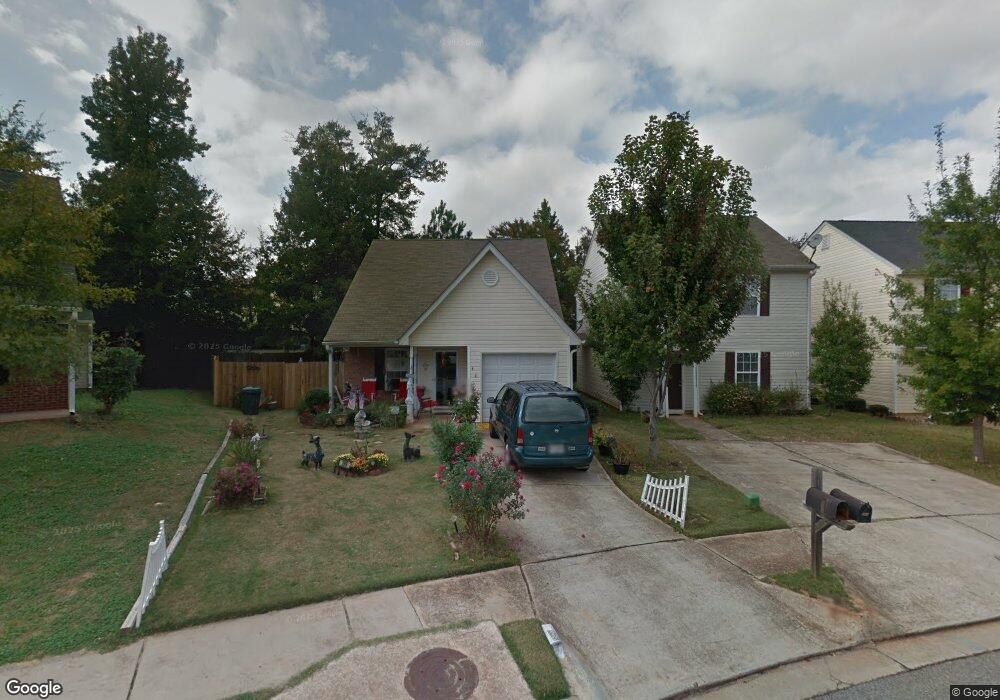
289 Coral Cir Unit 54 McDonough, GA 30253
Estimated Value: $205,000 - $224,777
2
Beds
3
Baths
1,294
Sq Ft
$168/Sq Ft
Est. Value
About This Home
This home is located at 289 Coral Cir Unit 54, McDonough, GA 30253 and is currently estimated at $217,194, approximately $167 per square foot. 289 Coral Cir Unit 54 is a home located in Henry County with nearby schools including Wesley Lakes Elementary School, McDonough Middle School, and McDonough Methodist Academy.
Ownership History
Date
Name
Owned For
Owner Type
Purchase Details
Closed on
Aug 8, 2007
Sold by
Fannie Mae
Bought by
Whitner Brandon
Current Estimated Value
Home Financials for this Owner
Home Financials are based on the most recent Mortgage that was taken out on this home.
Original Mortgage
$90,900
Outstanding Balance
$56,993
Interest Rate
6.56%
Mortgage Type
New Conventional
Estimated Equity
$160,201
Purchase Details
Closed on
Oct 3, 2006
Sold by
Netbank
Bought by
Fedl Natl Mtg Assoc
Purchase Details
Closed on
Feb 3, 2004
Sold by
Baxter Rodney
Bought by
Baxter Rodney and Baxter Amber
Purchase Details
Closed on
Mar 6, 2003
Sold by
Cliftwood Homes Inc
Bought by
Baxter Rodney
Home Financials for this Owner
Home Financials are based on the most recent Mortgage that was taken out on this home.
Original Mortgage
$108,247
Interest Rate
5.88%
Mortgage Type
New Conventional
Create a Home Valuation Report for This Property
The Home Valuation Report is an in-depth analysis detailing your home's value as well as a comparison with similar homes in the area
Home Values in the Area
Average Home Value in this Area
Purchase History
| Date | Buyer | Sale Price | Title Company |
|---|---|---|---|
| Whitner Brandon | -- | -- | |
| Fedl Natl Mtg Assoc | -- | -- | |
| Netbank | $109,214 | -- | |
| Baxter Rodney | -- | -- | |
| Baxter Rodney | $108,300 | -- |
Source: Public Records
Mortgage History
| Date | Status | Borrower | Loan Amount |
|---|---|---|---|
| Open | Whitner Brandon | $90,900 | |
| Previous Owner | Baxter Rodney | $108,247 |
Source: Public Records
Tax History Compared to Growth
Tax History
| Year | Tax Paid | Tax Assessment Tax Assessment Total Assessment is a certain percentage of the fair market value that is determined by local assessors to be the total taxable value of land and additions on the property. | Land | Improvement |
|---|---|---|---|---|
| 2025 | $2,397 | $90,360 | $12,000 | $78,360 |
| 2024 | $2,397 | $94,160 | $8,000 | $86,160 |
| 2023 | $2,001 | $91,120 | $8,000 | $83,120 |
| 2022 | $1,982 | $68,960 | $8,000 | $60,960 |
| 2021 | $1,528 | $49,720 | $8,000 | $41,720 |
| 2020 | $1,363 | $42,760 | $8,000 | $34,760 |
| 2019 | $1,265 | $39,000 | $8,000 | $31,000 |
| 2018 | $1,078 | $34,120 | $6,000 | $28,120 |
| 2016 | $933 | $30,360 | $5,000 | $25,360 |
| 2015 | $674 | $23,320 | $4,800 | $18,520 |
| 2014 | $486 | $18,520 | $4,000 | $14,520 |
Source: Public Records
Map
Nearby Homes
- 174 Madeline Ct
- 263 Coral Cir
- 433 Kara Ln
- 261 Coral Cir
- 132 Samanthas Way
- 116 Madeline Ct
- 167 London Dr
- 212 Jetta Cir
- 371 Coral Cir
- 108 Escalade Dr
- 408 Kendall Ln
- 205 Coral Cir
- 312 Sierra Ct
- 501 Epris Ln Unit 61
- 235 London Dr
- 371 Autumn Lake Dr
- 645 Stadler Pointe Unit 75
- 608 Pelican Place
- 625 Compton Ln
- 201 Autumn Lake Way Unit 1
- 291 Coral Cir Unit 55
- 287 Coral Cir
- 293 Coral Cir
- 285 Coral Cir
- 295 Coral Cir
- 295 Coral Cir
- 283 Coral Cir
- 292 Coral Cir Unit 220
- 284 Coral Cir Unit 219
- 297 Coral Cir
- 297 Coral Cir Unit 297
- 297 Coral Cir
- 281 Coral Cir
- 282 Coral Cir
- 299 Coral Cir
- 279 Coral Cir
- 280 Coral Cir
- 459 Kara Ln
- 457 Kara Ln Unit 222
- 301 Coral Cir