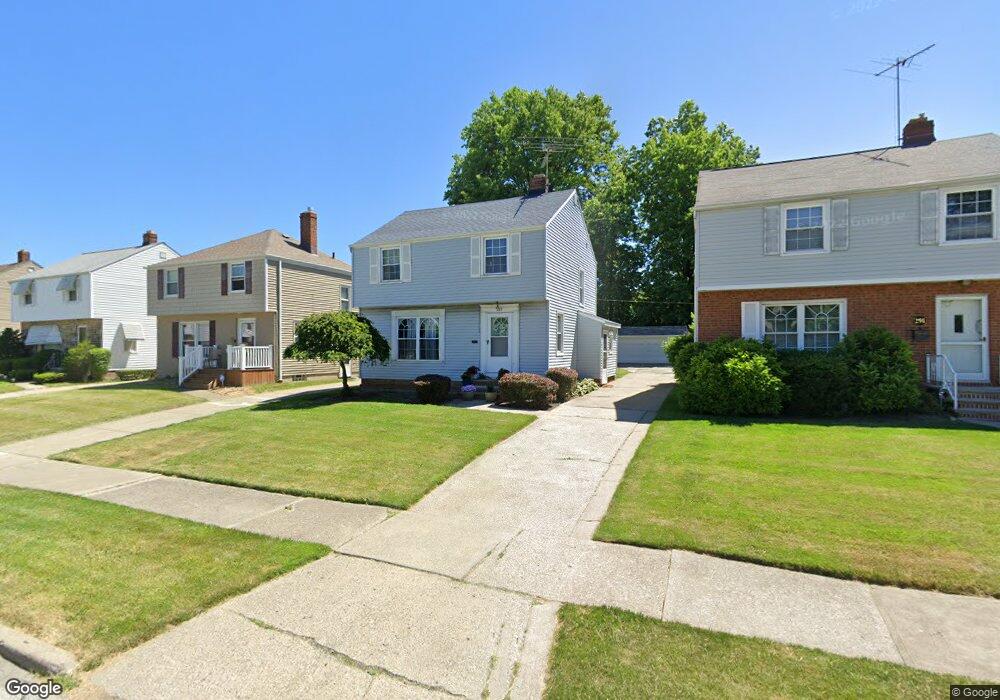
289 E 204th St Euclid, OH 44123
Estimated Value: $135,912 - $167,000
3
Beds
2
Baths
1,155
Sq Ft
$132/Sq Ft
Est. Value
About This Home
This home is located at 289 E 204th St, Euclid, OH 44123 and is currently estimated at $152,728, approximately $132 per square foot. 289 E 204th St is a home located in Cuyahoga County with nearby schools including Arbor Elementary School, Euclid Middle School, and Euclid High School.
Ownership History
Date
Name
Owned For
Owner Type
Purchase Details
Closed on
Aug 1, 2003
Sold by
Kosem Timothy M and Kosem Theresa
Bought by
Milbert Harold and Milbert Tina
Current Estimated Value
Home Financials for this Owner
Home Financials are based on the most recent Mortgage that was taken out on this home.
Original Mortgage
$116,000
Outstanding Balance
$47,355
Interest Rate
5.31%
Mortgage Type
Purchase Money Mortgage
Estimated Equity
$105,373
Purchase Details
Closed on
Aug 28, 1995
Sold by
Sukis Donald E
Bought by
Kosem Timothy M
Home Financials for this Owner
Home Financials are based on the most recent Mortgage that was taken out on this home.
Original Mortgage
$78,900
Interest Rate
7.43%
Mortgage Type
FHA
Purchase Details
Closed on
Aug 2, 1984
Sold by
Reed Chester G and Reed Mary F
Bought by
Sukis Donald E
Purchase Details
Closed on
Dec 9, 1982
Sold by
Reed Chester G and Reed Mary
Bought by
Reed Chester G and Reed Mary F
Purchase Details
Closed on
Jan 1, 1975
Bought by
Reed Chester G and Reed Mary
Create a Home Valuation Report for This Property
The Home Valuation Report is an in-depth analysis detailing your home's value as well as a comparison with similar homes in the area
Home Values in the Area
Average Home Value in this Area
Purchase History
| Date | Buyer | Sale Price | Title Company |
|---|---|---|---|
| Milbert Harold | $117,000 | -- | |
| Kosem Timothy M | $79,000 | -- | |
| Sukis Donald E | $58,000 | -- | |
| Reed Chester G | -- | -- | |
| Reed Chester G | -- | -- |
Source: Public Records
Mortgage History
| Date | Status | Borrower | Loan Amount |
|---|---|---|---|
| Open | Milbert Harold | $116,000 | |
| Closed | Kosem Timothy M | $78,900 |
Source: Public Records
Tax History
| Year | Tax Paid | Tax Assessment Tax Assessment Total Assessment is a certain percentage of the fair market value that is determined by local assessors to be the total taxable value of land and additions on the property. | Land | Improvement |
|---|---|---|---|---|
| 2025 | $3,267 | $49,105 | $9,660 | $39,445 |
| 2024 | $3,369 | $49,105 | $9,660 | $39,445 |
| 2023 | $2,762 | $31,860 | $6,970 | $24,890 |
| 2022 | $2,700 | $31,850 | $6,970 | $24,890 |
| 2021 | $3,010 | $31,850 | $6,970 | $24,890 |
| 2020 | $3,050 | $29,470 | $6,440 | $23,030 |
| 2019 | $2,742 | $84,200 | $18,400 | $65,800 |
| 2018 | $2,728 | $29,470 | $6,440 | $23,030 |
| 2017 | $2,914 | $25,910 | $5,360 | $20,550 |
| 2016 | $2,920 | $25,910 | $5,360 | $20,550 |
| 2015 | $2,658 | $25,910 | $5,360 | $20,550 |
| 2014 | $2,658 | $25,910 | $5,360 | $20,550 |
Source: Public Records
Map
Nearby Homes
- 20330 S Lake Shore Blvd
- 20700 Crystal Ave
- 273 E 208th St
- 275 E 200th St
- 20931 Priday Ave
- 21051 S Lake Shore Blvd
- 21000 Crystal Ave
- 20261 Fuller Ave
- 174 E 200th St
- 20900 Priday Ave
- 20591 Ball Ave
- 144 E 208th St
- 21181 Ball Ave
- 71 E 201st St
- 21051 Westport Ave
- 20751 Wilmore Ave
- 324 E 215th St
- 21670 Crystal Ave
- 21481 Ball Ave
- 80 E 197th St
- 285 E 204th St
- 281 E 204th St
- 20531 S Lake Shore Blvd
- 20501 S Lake Shore Blvd
- 277 E 204th St
- 20390 Ardwell Dr
- 271 E 204th St
- 20571 S Lake Shore Blvd
- 20391 S Lake Shore Blvd
- 20350 Ardwell Dr
- 20601 S Lake Shore Blvd
- 267 E 204th St
- 20381 S Lake Shore Blvd
- 276 E 204th St
- 20330 Ardwell Dr
- 20381 S Lake Shore
- 20651 S Lake Shore Blvd
- 270 E 204th St
- 261 E 204th St
- 20371 S Lake Shore Blvd
Your Personal Tour Guide
Ask me questions while you tour the home.