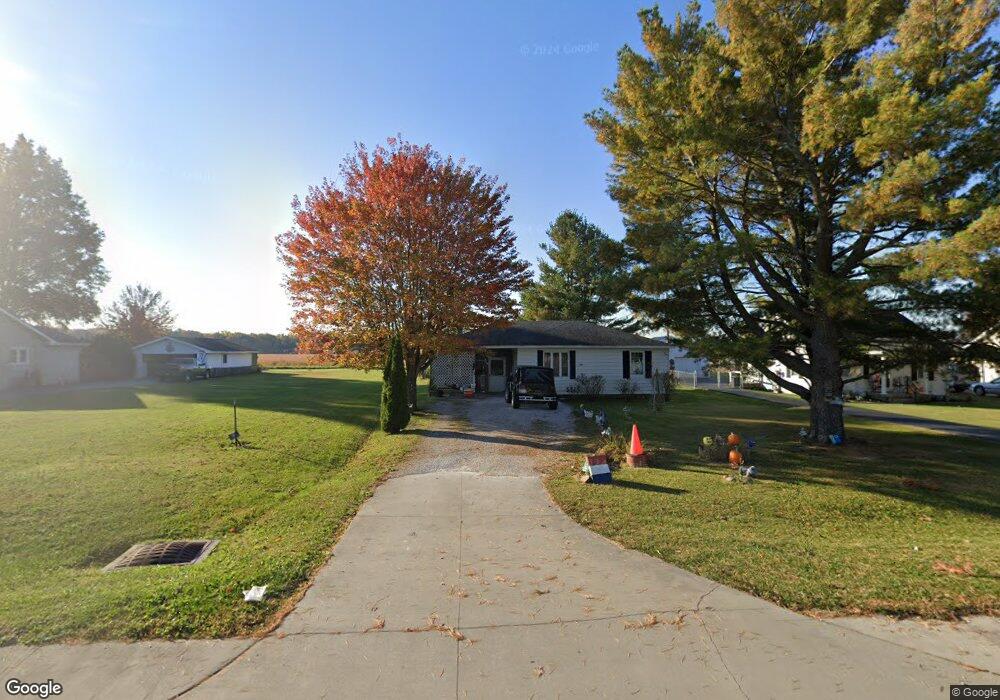
289 E Main St Austin, IN 47102
Estimated Value: $95,000 - $153,000
3
Beds
1
Bath
1,016
Sq Ft
$128/Sq Ft
Est. Value
About This Home
This home is located at 289 E Main St, Austin, IN 47102 and is currently estimated at $130,173, approximately $128 per square foot. 289 E Main St is a home located in Scott County with nearby schools including Austin Elementary School, Austin Middle School, and Austin High School.
Ownership History
Date
Name
Owned For
Owner Type
Purchase Details
Closed on
Feb 10, 2020
Sold by
Matney Bob J
Bought by
Matney Bob J and Matney Tyler B
Current Estimated Value
Purchase Details
Closed on
Nov 13, 2012
Sold by
Matney Bob J
Bought by
State Of Indiana
Purchase Details
Closed on
Nov 10, 2010
Sold by
Stone Francetta D and Stone Timothy L
Bought by
Nationstar Mortgage Llc and Centex Home Equity Company Llc
Purchase Details
Closed on
Jan 19, 2010
Sold by
Nationstar Mortgage Llc
Bought by
Matney Bob J
Create a Home Valuation Report for This Property
The Home Valuation Report is an in-depth analysis detailing your home's value as well as a comparison with similar homes in the area
Home Values in the Area
Average Home Value in this Area
Purchase History
| Date | Buyer | Sale Price | Title Company |
|---|---|---|---|
| Matney Bob J | -- | None Available | |
| State Of Indiana | $5,250 | None Available | |
| Nationstar Mortgage Llc | $58,904 | None Available | |
| Matney Bob J | $30,000 | None Available |
Source: Public Records
Tax History
| Year | Tax Paid | Tax Assessment Tax Assessment Total Assessment is a certain percentage of the fair market value that is determined by local assessors to be the total taxable value of land and additions on the property. | Land | Improvement |
|---|---|---|---|---|
| 2025 | $1,585 | $72,000 | $16,000 | $56,000 |
| 2024 | $1,585 | $64,300 | $16,000 | $48,300 |
| 2023 | $1,798 | $67,700 | $16,000 | $51,700 |
| 2022 | $1,516 | $68,300 | $16,000 | $52,300 |
| 2021 | $1,291 | $62,000 | $16,000 | $46,000 |
| 2020 | $1,172 | $57,900 | $16,000 | $41,900 |
| 2019 | $761 | $37,700 | $9,500 | $28,200 |
| 2018 | $801 | $39,600 | $9,500 | $30,100 |
| 2017 | $1,034 | $39,600 | $9,500 | $30,100 |
| 2016 | $771 | $38,100 | $9,500 | $28,600 |
| 2014 | $755 | $37,500 | $8,700 | $28,800 |
| 2013 | $755 | $35,700 | $8,700 | $27,000 |
Source: Public Records
Map
Nearby Homes
Your Personal Tour Guide
Ask me questions while you tour the home.