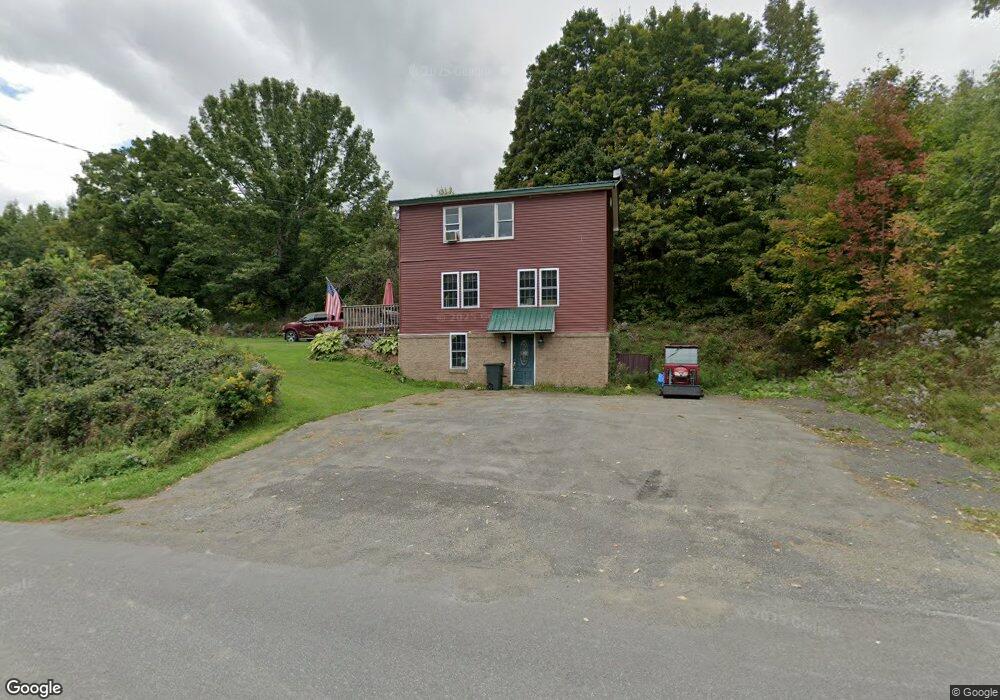
289 Grendell Rd Mapleton, ME 04757
Estimated Value: $130,000 - $201,000
1
Bed
3
Baths
1,144
Sq Ft
$150/Sq Ft
Est. Value
About This Home
This home is located at 289 Grendell Rd, Mapleton, ME 04757 and is currently estimated at $172,012, approximately $150 per square foot. 289 Grendell Rd is a home located in Aroostook County with nearby schools including Presque Isle Middle School and Presque Isle High School.
Ownership History
Date
Name
Owned For
Owner Type
Purchase Details
Closed on
Apr 30, 2020
Sold by
Dubay Robrt R and Dubay Gail
Bought by
Dubay Robert R and Dubay Gail A
Current Estimated Value
Home Financials for this Owner
Home Financials are based on the most recent Mortgage that was taken out on this home.
Original Mortgage
$98,100
Interest Rate
2.71%
Mortgage Type
Purchase Money Mortgage
Purchase Details
Closed on
Nov 4, 2015
Sold by
Dubay Robert R
Bought by
Dubay Robert R and Lahue Gail A
Purchase Details
Closed on
Feb 15, 2005
Sold by
Straetz Nathan
Bought by
Dubay Robert R
Home Financials for this Owner
Home Financials are based on the most recent Mortgage that was taken out on this home.
Original Mortgage
$45,000
Interest Rate
5.83%
Mortgage Type
Commercial
Create a Home Valuation Report for This Property
The Home Valuation Report is an in-depth analysis detailing your home's value as well as a comparison with similar homes in the area
Purchase History
| Date | Buyer | Sale Price | Title Company |
|---|---|---|---|
| Dubay Robert R | -- | None Available | |
| Dubay Robert R | -- | None Available | |
| Dubay Robert R | -- | None Available | |
| Dubay Robert R | -- | -- | |
| Dubay Robert R | -- | -- | |
| Dubay Robert R | -- | -- | |
| Dubay Robert R | -- | -- | |
| Dubay Robert R | -- | -- |
Source: Public Records
Mortgage History
| Date | Status | Borrower | Loan Amount |
|---|---|---|---|
| Closed | Dubay Robert R | $98,100 | |
| Closed | Dubay Robert R | $45,000 |
Source: Public Records
Tax History
| Year | Tax Paid | Tax Assessment Tax Assessment Total Assessment is a certain percentage of the fair market value that is determined by local assessors to be the total taxable value of land and additions on the property. | Land | Improvement |
|---|---|---|---|---|
| 2024 | $1,679 | $133,800 | $38,200 | $95,600 |
| 2023 | $1,488 | $104,400 | $30,200 | $74,200 |
| 2022 | $1,424 | $88,200 | $21,500 | $66,700 |
| 2021 | $1,424 | $88,200 | $21,500 | $66,700 |
| 2020 | $26 | $88,200 | $21,500 | $66,700 |
| 2019 | $1,422 | $88,900 | $21,500 | $67,400 |
| 2018 | $211 | $88,900 | $21,500 | $67,400 |
| 2017 | $1,381 | $89,400 | $21,200 | $68,200 |
| 2016 | $211 | $89,400 | $21,200 | $68,200 |
| 2015 | $1,344 | $90,800 | $21,900 | $68,900 |
| 2014 | $1,353 | $90,800 | $21,900 | $68,900 |
| 2013 | $1,327 | $91,500 | $21,900 | $69,600 |
Source: Public Records
Map
Nearby Homes
- 1616 Main St
- 40 Fords Ln
- 3091 W Chapman Rd
- 183 Pulcifur Rd
- 1776 Main St
- 0 Carvell Rd
- M2 L39-1 Pease Rd
- M8-L16 Grendell Rd
- 459 Griffin Ridge Rd
- Lot 7 Off Pulcifer Rd
- 228 Waddell Rd
- 673 Mapleton Rd
- 005-005 Grendell Rd
- 707 Hughes Rd
- 1421 State Rd
- 38 Elizabeth St
- 33 Elizabeth St
- 8 Lincoln St
- 4197 W Chapman Rd
- 83 Chapman Rd
- 275 Grendell Rd
- 313 Grendell Rd
- 211 Grendell Rd
- 335 Grendell Rd
- 48 Wonderview Dr
- 50 Wonderview Dr
- 217 Grendell Rd
- 34 Wonderview Dr
- 218 Grendell Rd
- 46 Wonderview Dr
- 47 Wonderview Dr
- 28 Wonderview Dr
- 185 Grendell Rd
- 197 Grendell Rd
- 20 Wonderview Dr
- 37 Wonderview Dr
- 183 Grendell Rd
- Lot 10 Estey Ln
- 10 Wonderview Dr
Your Personal Tour Guide
Ask me questions while you tour the home.