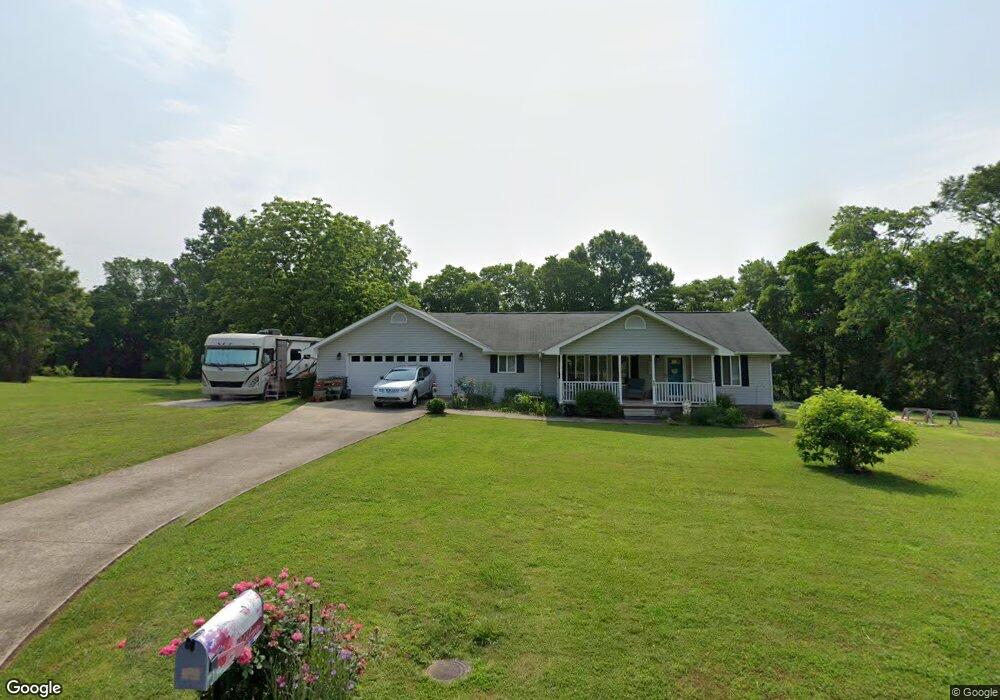
289 Holmes Dr Flintstone, GA 30725
Flintstone NeighborhoodEstimated Value: $298,000 - $333,000
--
Bed
2
Baths
1,949
Sq Ft
$159/Sq Ft
Est. Value
About This Home
This home is located at 289 Holmes Dr, Flintstone, GA 30725 and is currently estimated at $310,748, approximately $159 per square foot. 289 Holmes Dr is a home located in Walker County with nearby schools including Chattanooga Valley Elementary School, Chattanooga Valley Middle School, and Ridgeland High School.
Ownership History
Date
Name
Owned For
Owner Type
Purchase Details
Closed on
Aug 5, 2022
Sold by
Reynolds Alice S
Bought by
Reynolds Alice S and Haines Berndrudiger Wayne
Current Estimated Value
Purchase Details
Closed on
Oct 17, 1997
Sold by
Knox Finley Faxon
Bought by
Reynolds Alice S
Purchase Details
Closed on
Jan 1, 1972
Bought by
Knox Finley Faxon
Create a Home Valuation Report for This Property
The Home Valuation Report is an in-depth analysis detailing your home's value as well as a comparison with similar homes in the area
Home Values in the Area
Average Home Value in this Area
Purchase History
| Date | Buyer | Sale Price | Title Company |
|---|---|---|---|
| Reynolds Alice S | -- | -- | |
| Reynolds Alice S | -- | -- | |
| Knox Finley Faxon | -- | -- |
Source: Public Records
Tax History Compared to Growth
Tax History
| Year | Tax Paid | Tax Assessment Tax Assessment Total Assessment is a certain percentage of the fair market value that is determined by local assessors to be the total taxable value of land and additions on the property. | Land | Improvement |
|---|---|---|---|---|
| 2024 | $220 | $107,888 | $12,094 | $95,794 |
| 2023 | $1,740 | $81,720 | $10,798 | $70,922 |
| 2022 | $1,461 | $64,364 | $2,500 | $61,864 |
| 2021 | $1,335 | $53,234 | $2,500 | $50,734 |
| 2020 | $1,147 | $44,324 | $2,500 | $41,824 |
| 2019 | $1,170 | $44,324 | $2,500 | $41,824 |
| 2018 | $1,173 | $44,324 | $2,500 | $41,824 |
| 2017 | $1,166 | $44,324 | $2,500 | $41,824 |
| 2016 | $1,166 | $44,324 | $2,500 | $41,824 |
| 2015 | $1,392 | $50,458 | $5,048 | $45,410 |
| 2014 | $1,288 | $50,458 | $5,048 | $45,410 |
| 2013 | $1,173 | $50,458 | $5,048 | $45,410 |
Source: Public Records
Map
Nearby Homes
- 0 Cloud 9 Ln Unit RTC2915945
- 0 Cloud 9 Ln Unit 1514939
- 19 Turkey Run
- 206 Elaine Dr
- 244 Haven Hill
- 3509 N Highway N 341
- 3509 N Highway 341
- 404 W Schmitt Rd
- 144 N Victor Dr
- 2255 Nick-A Jack Rd
- 309 W Schmitt Rd
- 433 Stanford Dr
- 77 Kelley Ln
- 120 Williams Ave
- 0 Roundtree Ct Unit RTC2914889
- 0 Roundtree Ct Unit 1514898
- 1854 Powder Springs Cir
- 86 West Dr
- 301 Hidden Oaks Dr
- 0 W Schmidt Rd Unit 1507496
- 265 Holmes Dr
- 221 Holmes Dr
- 179 Holmes Dr
- 0 Nick A Jack Rd
- 0 Nick A Jack Rd Unit 1138731
- 189 Nick A Jack Ln
- 58 Nick A Jack Rd
- 85 Nick-A Jack Rd
- 5573 Highway 193
- 5573 Highway 193 Unit 1
- 5573 Georgia 193
- 44 Old Chattanooga Valley Rd
- 154 Nick A Jack Rd
- 4167 N Highway 341
- 5210 Highway 193
- 5210 Highway 193
- 20 Bloodworth Ct
- 20 Bloodworth Ct Unit 20 & 22
- 36 Bloodworth Ct
- 193 Highway