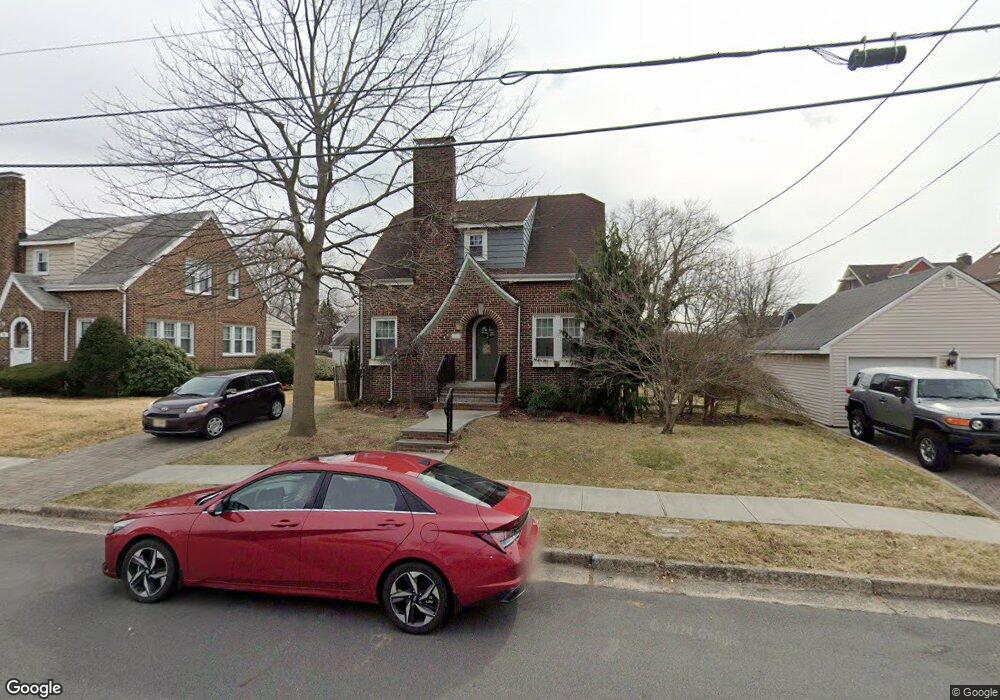
289 Hoover Ave Edison, NJ 08837
Estimated Value: $491,552 - $614,000
Studio
--
Bath
1,176
Sq Ft
$481/Sq Ft
Est. Value
About This Home
This home is located at 289 Hoover Ave, Edison, NJ 08837 and is currently estimated at $566,138, approximately $481 per square foot. 289 Hoover Ave is a home located in Middlesex County with nearby schools including James Monroe Elementary School, Herbert Hoover Middle School, and Edison High School.
Ownership History
Date
Name
Owned For
Owner Type
Purchase Details
Closed on
May 10, 2004
Sold by
Abood Grego4ry
Bought by
Keeton Ii Charles and Wieand Kelly
Current Estimated Value
Home Financials for this Owner
Home Financials are based on the most recent Mortgage that was taken out on this home.
Original Mortgage
$260,000
Outstanding Balance
$125,664
Interest Rate
5.94%
Estimated Equity
$440,474
Purchase Details
Closed on
Feb 5, 1999
Sold by
Chandy Aney
Bought by
Abood Gregory and Abood Bridget
Home Financials for this Owner
Home Financials are based on the most recent Mortgage that was taken out on this home.
Original Mortgage
$115,000
Interest Rate
6.74%
Purchase Details
Closed on
Mar 12, 1996
Sold by
Kovach Kathleen
Bought by
Kurien Abby and Kurien Aney
Home Financials for this Owner
Home Financials are based on the most recent Mortgage that was taken out on this home.
Original Mortgage
$140,000
Interest Rate
6.99%
Create a Home Valuation Report for This Property
The Home Valuation Report is an in-depth analysis detailing your home's value as well as a comparison with similar homes in the area
Home Values in the Area
Average Home Value in this Area
Purchase History
| Date | Buyer | Sale Price | Title Company |
|---|---|---|---|
| Keeton Ii Charles | $325,000 | -- | |
| Abood Gregory | $144,000 | -- | |
| Kurien Abby | $140,500 | -- |
Source: Public Records
Mortgage History
| Date | Status | Borrower | Loan Amount |
|---|---|---|---|
| Open | Keeton Ii Charles | $260,000 | |
| Previous Owner | Abood Gregory | $115,000 | |
| Previous Owner | Kurien Abby | $140,000 |
Source: Public Records
Tax History
| Year | Tax Paid | Tax Assessment Tax Assessment Total Assessment is a certain percentage of the fair market value that is determined by local assessors to be the total taxable value of land and additions on the property. | Land | Improvement |
|---|---|---|---|---|
| 2025 | $8,799 | $147,800 | $81,000 | $66,800 |
| 2024 | $8,751 | $147,800 | $81,000 | $66,800 |
Source: Public Records
Map
Nearby Homes
- 212 Echo Ave
- 162 Brower Ave
- 18A Garfield Park
- 18 Garfield Park Unit A
- 12 Garfield Park Unit A
- 2 Garfield Park
- 152 Fourth St
- 191 Hoover Ave
- 103 Liddle Ave
- 99 Liddle Ave Unit B10
- 81 Liddle Ave
- 2 Goodwill Place
- 26 Goodwill Place
- 84 Heman St
- 16 Hallo St
- 62 Harmon Rd
- 23 Carlton St
- 23 Carlton St S
- 122 Spear St
- 51 Dartmouth St
- 32 Lafayette Ave
- 28 Lafayette Ave
- 281 Hoover Ave
- 23 First St
- 24 Lafayette Ave
- 23 1st St
- 20 Lafayette Ave
- 36 Lafayette Ave
- 288 Hoover Ave
- 21 First St
- 282 Hoover Ave
- 40 Lafayette Ave
- 15 First St
- 279 Hoover Ave
- 11 First St
- 11 Lafayette Ave
- 9 Lafayette Ave
- 44 Lafayette Ave
- 12 Lafayette Ave
- 7 Lafayette Ave
Your Personal Tour Guide
Ask me questions while you tour the home.