Estimated Value: $478,000 - $558,000
--
Bed
--
Bath
2,581
Sq Ft
$196/Sq Ft
Est. Value
About This Home
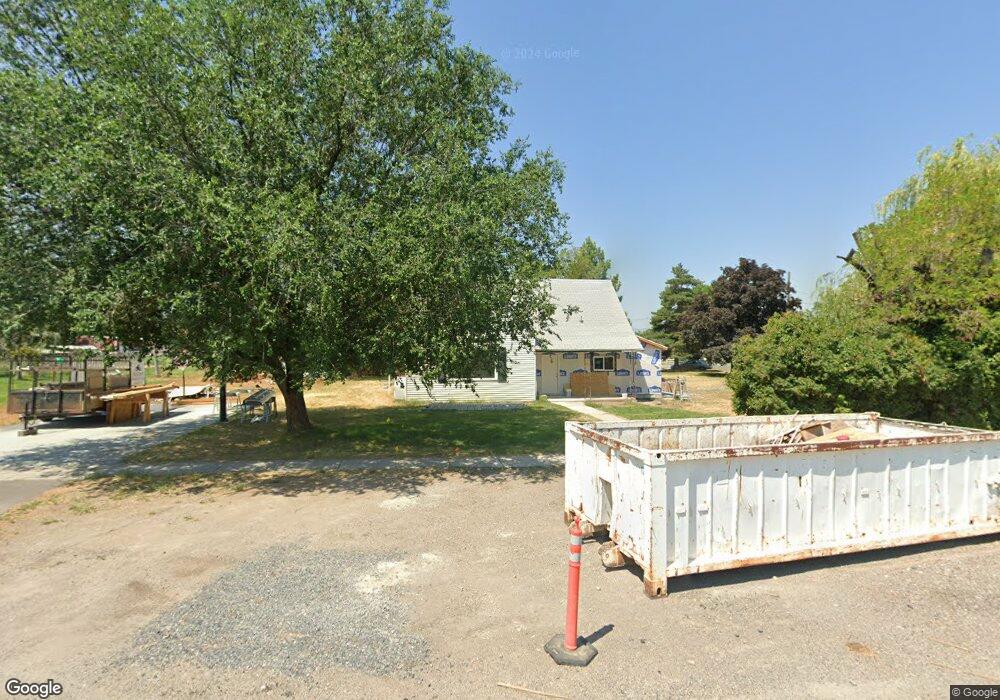
This home is located at 289 N 100 W Unit 2, Hyrum, UT 84319 and is currently estimated at $505,295, approximately $195 per square foot. 289 N 100 W Unit 2 is a home located in Cache County with nearby schools including Lincoln School, South Cache Middle School, and Mountain Crest High School.
Ownership History
Date
Name
Owned For
Owner Type
Purchase Details
Closed on
Apr 19, 2011
Sold by
Federal Home Loan Mortgage Corporation
Bought by
Andersen Ken and Andersen Ruth
Current Estimated Value
Home Financials for this Owner
Home Financials are based on the most recent Mortgage that was taken out on this home.
Original Mortgage
$89,553
Outstanding Balance
$61,328
Interest Rate
4.72%
Mortgage Type
New Conventional
Estimated Equity
$443,967
Purchase Details
Closed on
Oct 12, 2010
Sold by
Jenks Bryan and Wells Fargo Bank Na
Bought by
Federal Home Loan Mortgage Corporation
Purchase Details
Closed on
Apr 15, 2008
Sold by
Auman Randy and Auman Revocable T Marguerite B
Bought by
Jenks Bryan
Home Financials for this Owner
Home Financials are based on the most recent Mortgage that was taken out on this home.
Original Mortgage
$135,000
Interest Rate
5.99%
Mortgage Type
New Conventional
Create a Home Valuation Report for This Property
The Home Valuation Report is an in-depth analysis detailing your home's value as well as a comparison with similar homes in the area
Home Values in the Area
Average Home Value in this Area
Purchase History
| Date | Buyer | Sale Price | Title Company |
|---|---|---|---|
| Andersen Ken | -- | First American Union Heights | |
| Federal Home Loan Mortgage Corporation | $124,290 | Etitle Insurance Agency | |
| Jenks Bryan | -- | Cache Title Company |
Source: Public Records
Mortgage History
| Date | Status | Borrower | Loan Amount |
|---|---|---|---|
| Open | Andersen Ken | $89,553 | |
| Previous Owner | Jenks Bryan | $135,000 |
Source: Public Records
Tax History Compared to Growth
Tax History
| Year | Tax Paid | Tax Assessment Tax Assessment Total Assessment is a certain percentage of the fair market value that is determined by local assessors to be the total taxable value of land and additions on the property. | Land | Improvement |
|---|---|---|---|---|
| 2025 | $1,719 | $246,785 | $0 | $0 |
| 2024 | $1,800 | $241,410 | $0 | $0 |
| 2023 | $148 | $190,320 | $0 | $0 |
| 2022 | $1,554 | $190,930 | $0 | $0 |
| 2021 | $1,452 | $274,840 | $68,270 | $206,570 |
| 2020 | $1,279 | $227,170 | $68,270 | $158,900 |
| 2019 | $1,223 | $204,310 | $45,410 | $158,900 |
| 2018 | $830 | $134,114 | $45,410 | $88,704 |
| 2017 | $818 | $68,535 | $0 | $0 |
| 2016 | $836 | $68,535 | $0 | $0 |
| 2015 | $838 | $68,535 | $0 | $0 |
| 2014 | $818 | $68,370 | $0 | $0 |
| 2013 | -- | $60,980 | $0 | $0 |
Source: Public Records
Map
Nearby Homes