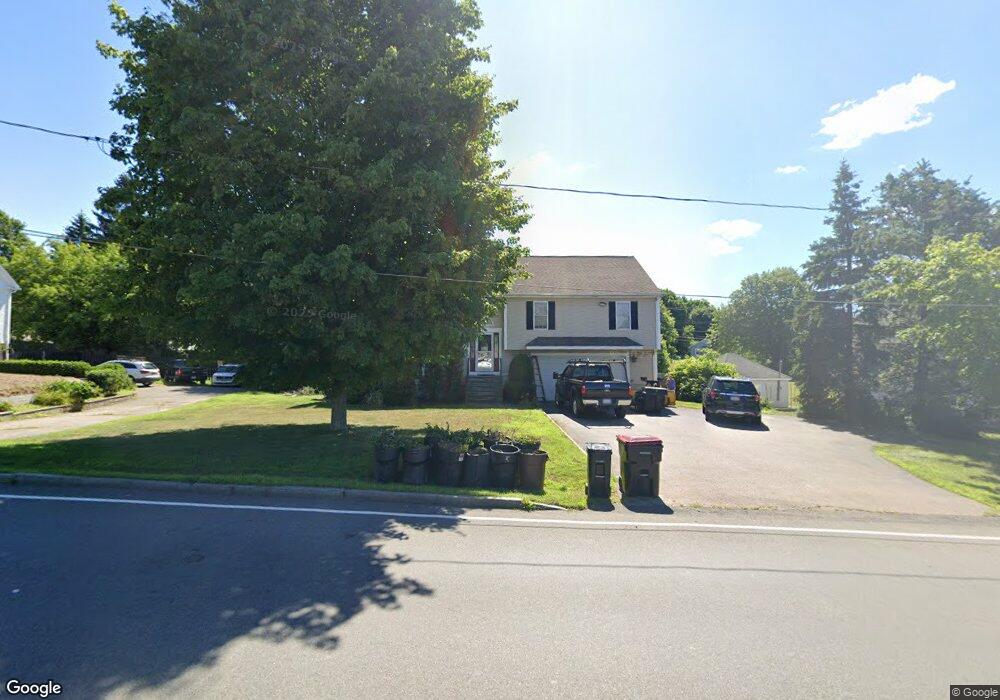
289 N Cary St Brockton, MA 02302
Montello NeighborhoodEstimated Value: $584,000 - $627,000
3
Beds
3
Baths
1,962
Sq Ft
$312/Sq Ft
Est. Value
About This Home
This home is located at 289 N Cary St, Brockton, MA 02302 and is currently estimated at $612,578, approximately $312 per square foot. 289 N Cary St is a home located in Plymouth County with nearby schools including Brookfield Elementary School, Downey Elementary School, and Ashfield Middle School.
Ownership History
Date
Name
Owned For
Owner Type
Purchase Details
Closed on
Oct 3, 2011
Sold by
Pircio Ann M
Bought by
Pircio Paul and Pircio Ann M
Current Estimated Value
Home Financials for this Owner
Home Financials are based on the most recent Mortgage that was taken out on this home.
Original Mortgage
$200,000
Outstanding Balance
$18,966
Interest Rate
4.15%
Mortgage Type
Purchase Money Mortgage
Estimated Equity
$593,612
Create a Home Valuation Report for This Property
The Home Valuation Report is an in-depth analysis detailing your home's value as well as a comparison with similar homes in the area
Home Values in the Area
Average Home Value in this Area
Purchase History
| Date | Buyer | Sale Price | Title Company |
|---|---|---|---|
| Pircio Paul | -- | -- |
Source: Public Records
Mortgage History
| Date | Status | Borrower | Loan Amount |
|---|---|---|---|
| Open | Pircio Paul | $200,000 |
Source: Public Records
Tax History Compared to Growth
Tax History
| Year | Tax Paid | Tax Assessment Tax Assessment Total Assessment is a certain percentage of the fair market value that is determined by local assessors to be the total taxable value of land and additions on the property. | Land | Improvement |
|---|---|---|---|---|
| 2025 | $6,355 | $524,800 | $156,100 | $368,700 |
| 2024 | $6,296 | $523,800 | $156,100 | $367,700 |
| 2023 | $6,238 | $480,600 | $121,800 | $358,800 |
| 2022 | $5,820 | $416,600 | $111,100 | $305,500 |
| 2021 | $6,113 | $421,600 | $102,000 | $319,600 |
| 2020 | $5,589 | $368,900 | $97,700 | $271,200 |
| 2019 | $5,392 | $347,000 | $91,200 | $255,800 |
| 2018 | $5,276 | $328,500 | $91,200 | $237,300 |
| 2017 | $5,059 | $314,200 | $91,200 | $223,000 |
| 2016 | $5,246 | $302,200 | $87,600 | $214,600 |
| 2015 | $5,262 | $289,900 | $87,600 | $202,300 |
| 2014 | $5,252 | $289,700 | $87,600 | $202,100 |
Source: Public Records
Map
Nearby Homes
- 341 E Ashland St
- 271 Ames St
- 69 Beacon Park
- 47 John Berman Dr
- 22 Blossom St
- 129 Anawan St
- 560 N Montello St
- 144 Ames St
- 115 Ames St
- 112 Ames St
- 24 E Ashland St
- 30 Intervale St
- 47 Taber Ave
- 18 Dixon Rd
- 421 Winter St
- 731 N Montello St Unit 6
- 737 N Montello St
- 35 Huntington St
- 18 N Manchester St
- 19 Ruth Rd