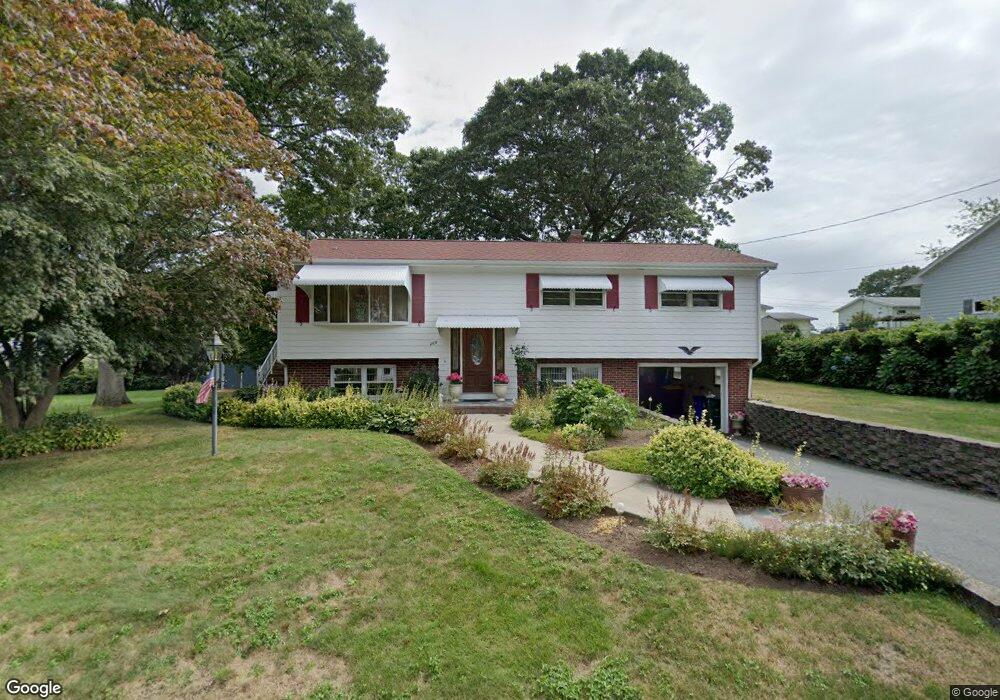
289 N Marion St Fall River, MA 02723
Oak Grove Village NeighborhoodEstimated Value: $491,000 - $556,000
3
Beds
2
Baths
2,102
Sq Ft
$242/Sq Ft
Est. Value
About This Home
This home is located at 289 N Marion St, Fall River, MA 02723 and is currently estimated at $508,304, approximately $241 per square foot. 289 N Marion St is a home located in Bristol County with nearby schools including Mary Fonseca Elementary School, Talbot Innovation School, and B M C Durfee High School.
Ownership History
Date
Name
Owned For
Owner Type
Purchase Details
Closed on
Sep 12, 2025
Sold by
Tavares Beverly A
Bought by
Tavares Beverly A
Current Estimated Value
Home Financials for this Owner
Home Financials are based on the most recent Mortgage that was taken out on this home.
Original Mortgage
$207,000
Outstanding Balance
$206,634
Interest Rate
6.63%
Mortgage Type
Purchase Money Mortgage
Estimated Equity
$301,670
Create a Home Valuation Report for This Property
The Home Valuation Report is an in-depth analysis detailing your home's value as well as a comparison with similar homes in the area
Home Values in the Area
Average Home Value in this Area
Purchase History
| Date | Buyer | Sale Price | Title Company |
|---|---|---|---|
| Tavares Beverly A | -- | -- |
Source: Public Records
Mortgage History
| Date | Status | Borrower | Loan Amount |
|---|---|---|---|
| Open | Tavares Beverly A | $207,000 |
Source: Public Records
Tax History Compared to Growth
Tax History
| Year | Tax Paid | Tax Assessment Tax Assessment Total Assessment is a certain percentage of the fair market value that is determined by local assessors to be the total taxable value of land and additions on the property. | Land | Improvement |
|---|---|---|---|---|
| 2025 | $4,601 | $401,800 | $146,400 | $255,400 |
| 2024 | $4,234 | $368,500 | $140,800 | $227,700 |
| 2023 | $3,762 | $306,600 | $121,700 | $184,900 |
| 2022 | $3,447 | $273,100 | $113,800 | $159,300 |
| 2021 | $3,409 | $246,500 | $114,200 | $132,300 |
| 2020 | $3,454 | $239,000 | $114,400 | $124,600 |
| 2019 | $3,511 | $240,800 | $116,200 | $124,600 |
| 2018 | $3,471 | $237,400 | $122,700 | $114,700 |
| 2017 | $3,182 | $227,300 | $116,800 | $110,500 |
| 2016 | $2,950 | $216,400 | $119,200 | $97,200 |
| 2015 | $2,680 | $204,900 | $104,800 | $100,100 |
| 2014 | $2,578 | $204,900 | $104,800 | $100,100 |
Source: Public Records
Map
Nearby Homes
- 1796 Locust St
- 44 Fenmore St
- 168 Windsor St
- 235 Chavenson St
- 243 Oak Grove Ave
- 200 David St
- 302 Oak Grove Ave
- 344 Beattie St Unit 5
- 380 Eddy St
- 14 Downing St
- 23 Lexington St
- 159 Covel St
- 350 Doherty St
- 36 Fordney St
- 34 Quequechan St
- 32 Quequechan St
- 83 Jencks St
- 89 Lafayette St
- 88 Harrison St Unit 5
- 48 Rocliffe St
- 265 N Marion St
- 288 Stonehaven Rd
- 1785 Locust St
- 268 Stonehaven Rd
- 282 N Marion St
- 1809 Locust St
- 290 N Marion St
- 245 N Marion St
- 262 N Marion St
- 1751 Locust St
- 236 Stonehaven Rd
- 244 N Marion St
- 281 N Ogden St
- 301 N Ogden St
- 1780 Locust St
- 225 N Marion St
- 263 N Ogden St
- 1766 Locust St
- 1727 Locust St
- 232 Stonehaven Rd