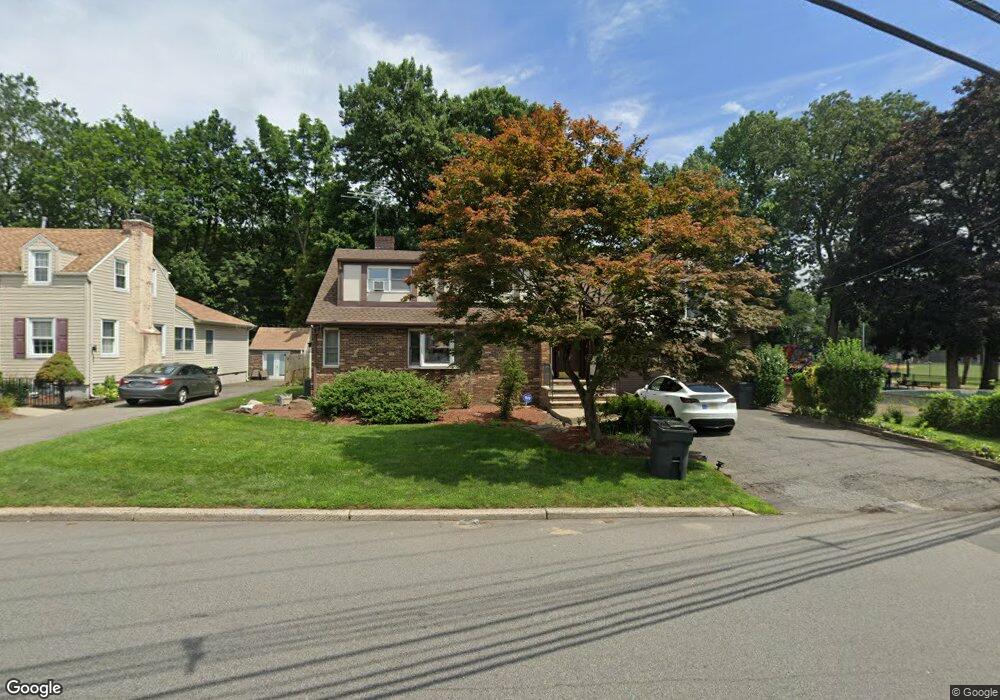
289 New Bridge Rd Bergenfield, NJ 07621
Estimated Value: $791,019 - $968,000
--
Bed
--
Bath
2,724
Sq Ft
$330/Sq Ft
Est. Value
About This Home
This home is located at 289 New Bridge Rd, Bergenfield, NJ 07621 and is currently estimated at $899,255, approximately $330 per square foot. 289 New Bridge Rd is a home located in Bergen County with nearby schools including Bergenfield High School and Torah Academy of Bergen County.
Ownership History
Date
Name
Owned For
Owner Type
Purchase Details
Closed on
Mar 2, 2007
Sold by
Farkas Maria
Bought by
Farkas Julie
Current Estimated Value
Purchase Details
Closed on
Jul 23, 1999
Sold by
Hill Thomas P and Hill Ann
Bought by
Farkas Maria
Home Financials for this Owner
Home Financials are based on the most recent Mortgage that was taken out on this home.
Original Mortgage
$224,000
Interest Rate
7.65%
Create a Home Valuation Report for This Property
The Home Valuation Report is an in-depth analysis detailing your home's value as well as a comparison with similar homes in the area
Home Values in the Area
Average Home Value in this Area
Purchase History
| Date | Buyer | Sale Price | Title Company |
|---|---|---|---|
| Farkas Julie | -- | -- | |
| Farkas Maria | $280,000 | First Jersey Title Services |
Source: Public Records
Mortgage History
| Date | Status | Borrower | Loan Amount |
|---|---|---|---|
| Previous Owner | Farkas Maria | $224,000 |
Source: Public Records
Tax History Compared to Growth
Tax History
| Year | Tax Paid | Tax Assessment Tax Assessment Total Assessment is a certain percentage of the fair market value that is determined by local assessors to be the total taxable value of land and additions on the property. | Land | Improvement |
|---|---|---|---|---|
| 2025 | $13,918 | $394,600 | $151,200 | $243,400 |
| 2024 | $13,456 | $394,600 | $151,200 | $243,400 |
| 2023 | $13,247 | $394,600 | $151,200 | $243,400 |
| 2022 | $13,247 | $394,600 | $151,200 | $243,400 |
| 2021 | $13,109 | $394,600 | $151,200 | $243,400 |
| 2020 | $13,022 | $394,600 | $151,200 | $243,400 |
| 2019 | $12,872 | $394,600 | $151,200 | $243,400 |
| 2018 | $12,777 | $394,600 | $151,200 | $243,400 |
| 2017 | $12,714 | $394,600 | $151,200 | $243,400 |
| 2016 | $12,513 | $394,600 | $151,200 | $243,400 |
| 2015 | $12,319 | $394,600 | $151,200 | $243,400 |
| 2014 | $12,094 | $394,600 | $151,200 | $243,400 |
Source: Public Records
Map
Nearby Homes
- 201 Maiden Ln
- 388 S Prospect Ave
- 98 John Place
- 55 Maiden Ln
- 10 Judith Place
- 207 Melrose Ave
- 21 Briarcliffe Rd
- 42 Westview Dr
- 70 Greenwich St
- 466 New Bridge Rd
- 64 Glenwood Dr S
- 15 Brown Place
- 111 Dudley Dr
- 17 S Paula Dr
- 532 Winthrop Rd
- 12 Lerome Place
- 512 Warwick Ave Unit 3A
- 15 Westside Ave
- 591 Warwick Ave
- 86 Levitt Ave