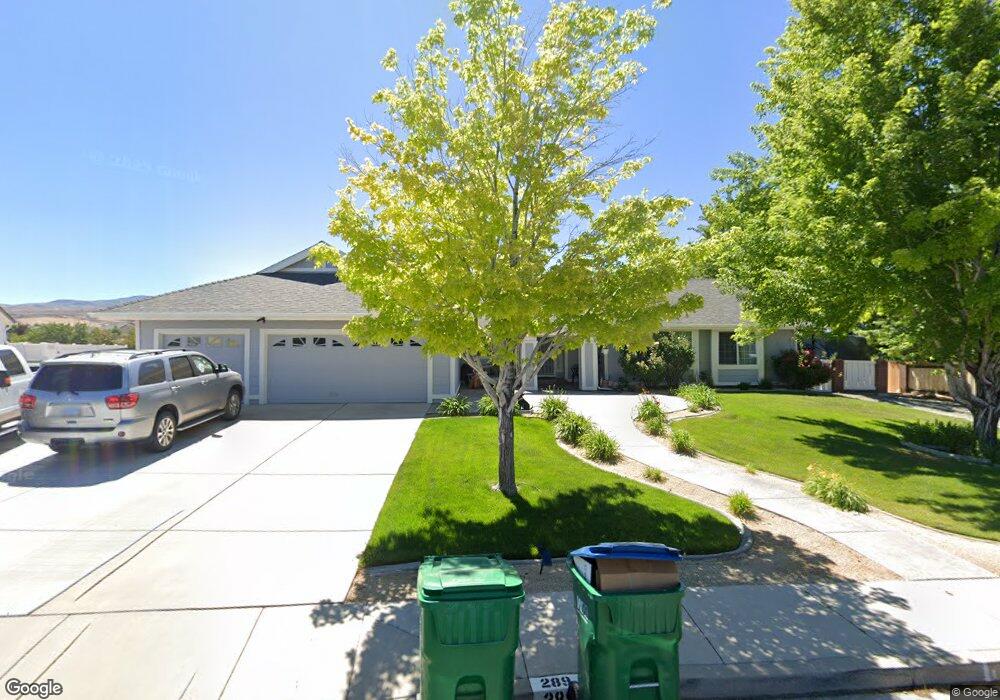
289 Omni Dr Unit 6 Sparks, NV 89441
Sky Ranch NeighborhoodEstimated Value: $829,770 - $902,000
3
Beds
2
Baths
2,056
Sq Ft
$426/Sq Ft
Est. Value
About This Home
This home is located at 289 Omni Dr Unit 6, Sparks, NV 89441 and is currently estimated at $875,193, approximately $425 per square foot. 289 Omni Dr Unit 6 is a home located in Washoe County with nearby schools including Spanish Springs Elementary School, Yvonne Shaw Middle School, and Spanish Springs High School.
Ownership History
Date
Name
Owned For
Owner Type
Purchase Details
Closed on
Nov 27, 2020
Sold by
Unknown
Bought by
Fisher Tyler J and Hamblin-Fisher Terra
Current Estimated Value
Purchase Details
Closed on
Aug 15, 2011
Sold by
Maples Crill and Maples Theresa
Bought by
Fisher Tyler J
Home Financials for this Owner
Home Financials are based on the most recent Mortgage that was taken out on this home.
Original Mortgage
$268,028
Interest Rate
4.25%
Mortgage Type
FHA
Purchase Details
Closed on
Feb 26, 1999
Sold by
Maples Crill and Maples Theresa
Bought by
Maples Crill and Maples Theresa
Purchase Details
Closed on
Aug 6, 1996
Sold by
Oakspring Associates
Bought by
Maples Crill and Maples Theresa
Home Financials for this Owner
Home Financials are based on the most recent Mortgage that was taken out on this home.
Original Mortgage
$149,160
Interest Rate
8.18%
Create a Home Valuation Report for This Property
The Home Valuation Report is an in-depth analysis detailing your home's value as well as a comparison with similar homes in the area
Home Values in the Area
Average Home Value in this Area
Purchase History
| Date | Buyer | Sale Price | Title Company |
|---|---|---|---|
| Fisher Tyler J | -- | None Listed On Document | |
| Fisher Tyler J | $281,500 | First American Title Sparks | |
| Maples Crill | -- | United Title | |
| Maples Crill | $188,500 | First American Title Co |
Source: Public Records
Mortgage History
| Date | Status | Borrower | Loan Amount |
|---|---|---|---|
| Previous Owner | Fisher Tyler J | $268,028 | |
| Previous Owner | Maples Crill | $149,160 |
Source: Public Records
Tax History Compared to Growth
Tax History
| Year | Tax Paid | Tax Assessment Tax Assessment Total Assessment is a certain percentage of the fair market value that is determined by local assessors to be the total taxable value of land and additions on the property. | Land | Improvement |
|---|---|---|---|---|
| 2025 | $3,823 | $143,573 | $62,720 | $80,853 |
| 2024 | $3,823 | $136,445 | $54,635 | $81,810 |
| 2023 | $3,541 | $131,318 | $53,795 | $77,523 |
| 2022 | $3,279 | $114,370 | $49,525 | $64,845 |
| 2021 | $3,036 | $103,815 | $39,060 | $64,755 |
| 2020 | $2,854 | $96,442 | $35,070 | $61,372 |
| 2019 | $2,719 | $94,418 | $34,930 | $59,488 |
| 2018 | $2,594 | $82,128 | $23,660 | $58,468 |
| 2017 | $2,490 | $80,694 | $21,980 | $58,714 |
| 2016 | $2,426 | $79,332 | $19,425 | $59,907 |
| 2015 | $2,421 | $79,070 | $19,005 | $60,065 |
| 2014 | $2,346 | $74,379 | $16,310 | $58,069 |
| 2013 | -- | $70,304 | $13,125 | $57,179 |
Source: Public Records
Map
Nearby Homes
- 25 Martell Place Unit 6
- 415 Sunset Springs Ln
- 245 Moonbeam Dr Unit 5
- Plan 11 at Silver Canyon
- Plan 10 at Silver Canyon
- Plan 9 at Silver Canyon
- Plan 8 at Silver Canyon
- Plan 7 at Silver Canyon
- Plan 6 at Silver Canyon
- Plan 5 at Silver Canyon
- Plan 4 at Silver Canyon
- Plan 3 at Silver Canyon
- Plan 2 at Silver Canyon
- Plan 1 at Silver Canyon
- 75 Wootton Downs Dr
- 430 Calle de la Plata
- 2324 Hickory Dr Unit 61
- 2319 Hickory Dr Unit 77
- 2350 Seaberry Dr
- 2222 Slater Mill Dr
- 287 Omni Dr
- 291 Omni Dr
- 288 Omni Dr
- 290 Omni Dr
- 293 Omni Dr
- 292 Omni Dr
- 295 Omni Dr
- 665 Tranquil Dr
- 675 Tranquil Dr
- 294 Omni Dr
- 9731 Smoke Wagon Dr
- 297 Omni Dr
- 685 Tranquil Dr
- 9727 Smoke Wagon Dr
- 9737 Smoke Wagon Dr
- 296 Omni Dr Unit 6
- 9721 Smoke Wagon Dr
- 655 Tranquil Dr Unit 4
- 9741 Smoke Wagon Dr
- 695 Tranquil Dr Unit 6