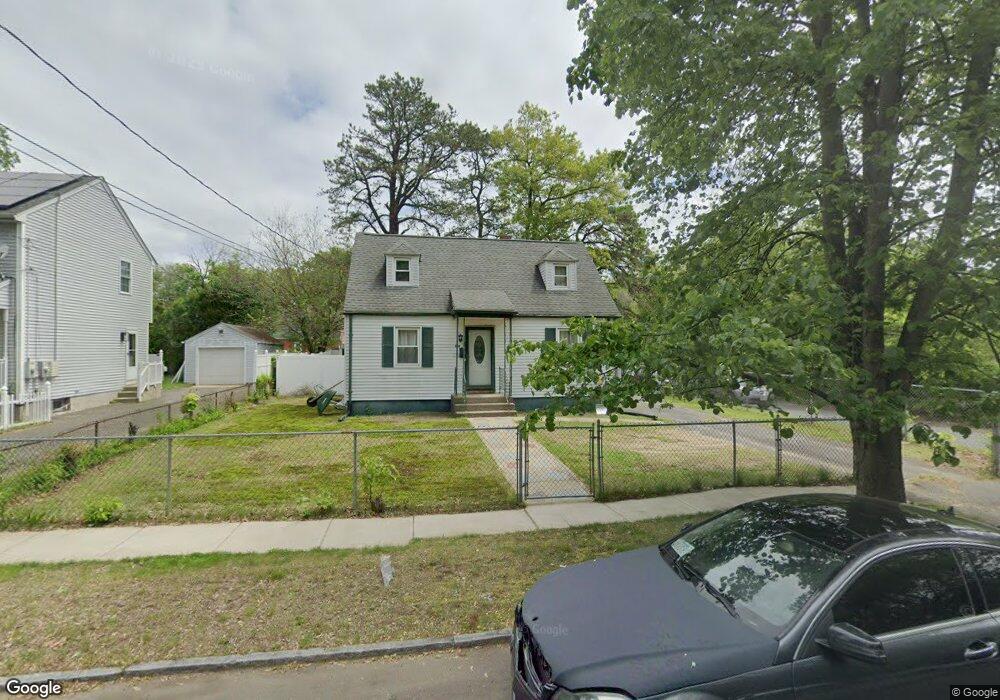
289 Pheland St Springfield, MA 01109
Pine Point NeighborhoodEstimated Value: $227,000 - $296,000
3
Beds
1
Bath
1,116
Sq Ft
$239/Sq Ft
Est. Value
About This Home
This home is located at 289 Pheland St, Springfield, MA 01109 and is currently estimated at $266,664, approximately $238 per square foot. 289 Pheland St is a home located in Hampden County with nearby schools including Frank H. Freedman School, John J Duggan Middle, and Springfield Central High School.
Ownership History
Date
Name
Owned For
Owner Type
Purchase Details
Closed on
Nov 14, 2003
Sold by
Tremble Eugene R and Palardy Sandra Ella
Bought by
Lopez Lourdes
Current Estimated Value
Home Financials for this Owner
Home Financials are based on the most recent Mortgage that was taken out on this home.
Original Mortgage
$85,200
Outstanding Balance
$38,977
Interest Rate
5.81%
Mortgage Type
Purchase Money Mortgage
Estimated Equity
$227,687
Purchase Details
Closed on
Feb 24, 2003
Sold by
Tremble Eugene R
Bought by
Tremble Eugene R and Palardy Sandra Ella
Create a Home Valuation Report for This Property
The Home Valuation Report is an in-depth analysis detailing your home's value as well as a comparison with similar homes in the area
Home Values in the Area
Average Home Value in this Area
Purchase History
| Date | Buyer | Sale Price | Title Company |
|---|---|---|---|
| Lopez Lourdes | $87,900 | -- | |
| Tremble Eugene R | -- | -- |
Source: Public Records
Mortgage History
| Date | Status | Borrower | Loan Amount |
|---|---|---|---|
| Open | Lopez Lourdes | $85,200 | |
| Closed | Lopez Lourdes | $3,000 |
Source: Public Records
Tax History
| Year | Tax Paid | Tax Assessment Tax Assessment Total Assessment is a certain percentage of the fair market value that is determined by local assessors to be the total taxable value of land and additions on the property. | Land | Improvement |
|---|---|---|---|---|
| 2025 | $3,170 | $202,200 | $40,400 | $161,800 |
| 2024 | $2,978 | $185,400 | $33,700 | $151,700 |
| 2023 | $3,003 | $176,100 | $30,600 | $145,500 |
| 2022 | $3,047 | $161,900 | $28,600 | $133,300 |
| 2021 | $2,480 | $131,200 | $26,100 | $105,100 |
| 2020 | $2,308 | $118,200 | $26,100 | $92,100 |
| 2019 | $2,145 | $109,000 | $26,100 | $82,900 |
| 2018 | $2,100 | $106,700 | $26,100 | $80,600 |
| 2017 | $2,117 | $107,700 | $24,100 | $83,600 |
| 2016 | $1,791 | $91,100 | $24,100 | $67,000 |
| 2015 | $1,788 | $90,900 | $24,100 | $66,800 |
Source: Public Records
Map
Nearby Homes
Your Personal Tour Guide
Ask me questions while you tour the home.