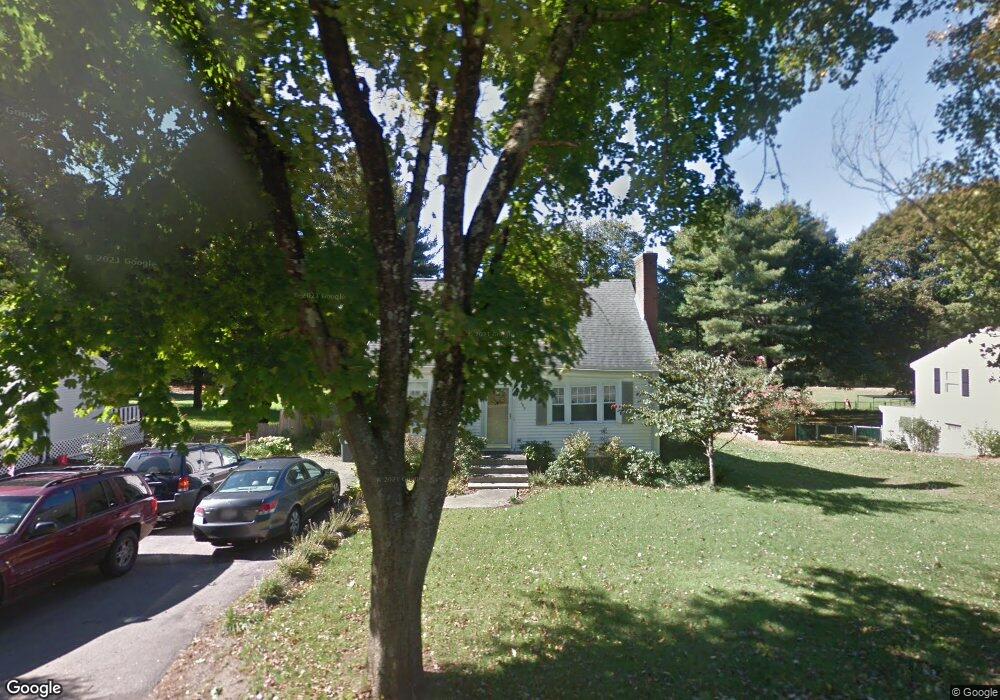
289 Plain St Millis, MA 02054
Estimated Value: $605,000 - $656,000
3
Beds
3
Baths
1,742
Sq Ft
$359/Sq Ft
Est. Value
About This Home
This home is located at 289 Plain St, Millis, MA 02054 and is currently estimated at $625,129, approximately $358 per square foot. 289 Plain St is a home located in Norfolk County with nearby schools including Clyde F Brown, Millis Middle School, and Millis High School.
Ownership History
Date
Name
Owned For
Owner Type
Purchase Details
Closed on
Dec 18, 2017
Sold by
Bourque Andre P
Bought by
Bourque Andre P and Bourque Anita V
Current Estimated Value
Purchase Details
Closed on
Aug 18, 2017
Sold by
Baker Michael D
Bought by
Arian Hany S and Louis Matilda
Purchase Details
Closed on
Nov 30, 2000
Sold by
Healy Robert J and Healy Nancy L
Bought by
Bourque Andre P
Home Financials for this Owner
Home Financials are based on the most recent Mortgage that was taken out on this home.
Original Mortgage
$60,000
Interest Rate
7.76%
Mortgage Type
Purchase Money Mortgage
Create a Home Valuation Report for This Property
The Home Valuation Report is an in-depth analysis detailing your home's value as well as a comparison with similar homes in the area
Home Values in the Area
Average Home Value in this Area
Purchase History
| Date | Buyer | Sale Price | Title Company |
|---|---|---|---|
| Bourque Andre P | -- | -- | |
| Arian Hany S | $434,000 | -- | |
| Bourque Andre P | $245,500 | -- |
Source: Public Records
Mortgage History
| Date | Status | Borrower | Loan Amount |
|---|---|---|---|
| Previous Owner | Bourque Andre P | $60,000 | |
| Previous Owner | Bourque Andre P | $80,000 | |
| Previous Owner | Bourque Andre P | $80,000 | |
| Previous Owner | Bourque Andre P | $25,000 |
Source: Public Records
Tax History
| Year | Tax Paid | Tax Assessment Tax Assessment Total Assessment is a certain percentage of the fair market value that is determined by local assessors to be the total taxable value of land and additions on the property. | Land | Improvement |
|---|---|---|---|---|
| 2025 | $8,963 | $546,500 | $231,100 | $315,400 |
| 2024 | $8,228 | $501,100 | $213,300 | $287,800 |
| 2023 | $7,647 | $437,200 | $170,100 | $267,100 |
| 2022 | $7,741 | $410,000 | $182,400 | $227,600 |
| 2021 | $7,159 | $364,900 | $157,700 | $207,200 |
| 2020 | $7,383 | $366,600 | $147,400 | $219,200 |
| 2019 | $6,412 | $342,900 | $134,000 | $208,900 |
| 2018 | $6,179 | $342,900 | $134,000 | $208,900 |
| 2017 | $5,692 | $309,000 | $114,200 | $194,800 |
| 2016 | $5,389 | $309,000 | $114,200 | $194,800 |
| 2015 | $5,253 | $309,000 | $114,200 | $194,800 |
Source: Public Records
Map
Nearby Homes
Your Personal Tour Guide
Ask me questions while you tour the home.