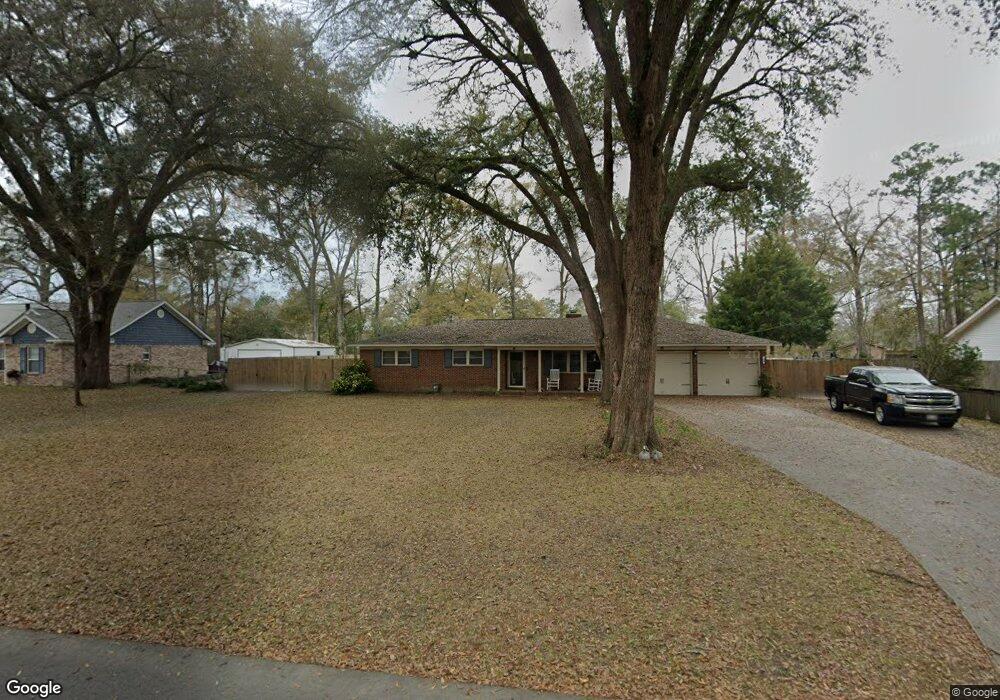
289 Queens Way Ellabell, GA 31308
Estimated Value: $274,000 - $322,000
3
Beds
2
Baths
1,760
Sq Ft
$169/Sq Ft
Est. Value
About This Home
This home is located at 289 Queens Way, Ellabell, GA 31308 and is currently estimated at $297,642, approximately $169 per square foot. 289 Queens Way is a home located in Bryan County with nearby schools including Lanier Primary School, Bryan County Elementary School, and Bryan County Middle School.
Ownership History
Date
Name
Owned For
Owner Type
Purchase Details
Closed on
May 21, 2016
Sold by
Lowe Wanda
Bought by
Stafford Rodney L and Stafford Wanda J
Current Estimated Value
Home Financials for this Owner
Home Financials are based on the most recent Mortgage that was taken out on this home.
Original Mortgage
$121,642
Outstanding Balance
$95,521
Interest Rate
3.25%
Mortgage Type
FHA
Estimated Equity
$202,121
Purchase Details
Closed on
Oct 28, 2008
Sold by
Hsbc Mortgage Services Inc
Bought by
Lowe Wanda
Home Financials for this Owner
Home Financials are based on the most recent Mortgage that was taken out on this home.
Original Mortgage
$88,740
Interest Rate
6.11%
Mortgage Type
New Conventional
Purchase Details
Closed on
Aug 5, 2008
Sold by
Ryea Leroy and Ryea Serena
Bought by
Hsbc Mortgage Services Inc
Purchase Details
Closed on
Aug 6, 2004
Sold by
White Crystal L & Ch
Bought by
Ryea Leroy and Ryea Serena
Purchase Details
Closed on
Dec 7, 2000
Sold by
Davis Jimmy Grace
Bought by
White Crystal L & Ch
Purchase Details
Closed on
Jul 1, 1998
Bought by
Davis Jimmy Grace
Create a Home Valuation Report for This Property
The Home Valuation Report is an in-depth analysis detailing your home's value as well as a comparison with similar homes in the area
Home Values in the Area
Average Home Value in this Area
Purchase History
| Date | Buyer | Sale Price | Title Company |
|---|---|---|---|
| Stafford Rodney L | -- | -- | |
| Lowe Wanda | $87,000 | -- | |
| Hsbc Mortgage Services Inc | -- | -- | |
| Ryea Leroy | $116,500 | -- | |
| White Crystal L & Ch | $70,000 | -- | |
| Davis Jimmy Grace | -- | -- |
Source: Public Records
Mortgage History
| Date | Status | Borrower | Loan Amount |
|---|---|---|---|
| Open | Stafford Rodney L | $121,642 | |
| Previous Owner | Lowe Wanda | $88,740 |
Source: Public Records
Tax History Compared to Growth
Tax History
| Year | Tax Paid | Tax Assessment Tax Assessment Total Assessment is a certain percentage of the fair market value that is determined by local assessors to be the total taxable value of land and additions on the property. | Land | Improvement |
|---|---|---|---|---|
| 2024 | $1,360 | $88,000 | $18,480 | $69,520 |
| 2023 | $1,296 | $73,292 | $16,800 | $56,492 |
| 2022 | $792 | $66,372 | $21,000 | $45,372 |
| 2021 | $1,721 | $64,732 | $21,000 | $43,732 |
| 2020 | $1,401 | $56,292 | $16,000 | $40,292 |
| 2019 | $1,334 | $48,560 | $9,600 | $38,960 |
| 2018 | $1,270 | $48,560 | $9,600 | $38,960 |
| 2017 | $1,141 | $46,888 | $9,600 | $37,288 |
| 2016 | $1,127 | $45,968 | $9,600 | $36,368 |
| 2015 | $1,098 | $44,608 | $9,600 | $35,008 |
| 2014 | $1,116 | $45,240 | $9,600 | $35,640 |
Source: Public Records
Map
Nearby Homes
- 12010 Highway 280 E
- 101 Shimmering Dell Dr
- 535 & 565 Deer Run Rd
- 0 Sand Hill Rd Unit 325134
- 132 Brandi Ln
- 218 Ridge Rd
- 327 Bay Ln
- 101 Buford Hill Rd
- 472 S Laurel Cir
- 338 Bay
- 906 Coosa Cove Unit 168
- 906 Coosa Cove
- 208 Cypress Lake Dr
- 132 River Bluff Way
- 1530 Olive Branch Rd
- 1560 Olive Branch Rd
- 3290 Eldora Rd
- 100 Concord Dr
- 162 Royal Oak Dr
- 73 Crestview Dr