289 S 1000 W Unit 203 Pleasant Grove, UT 84062
Estimated payment $2,034/month
Highlights
- Heated In Ground Pool
- Clubhouse
- Balcony
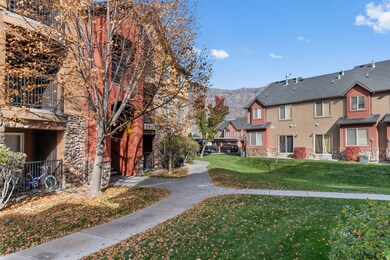
- Mountain View
- Granite Countertops
- Double Pane Windows
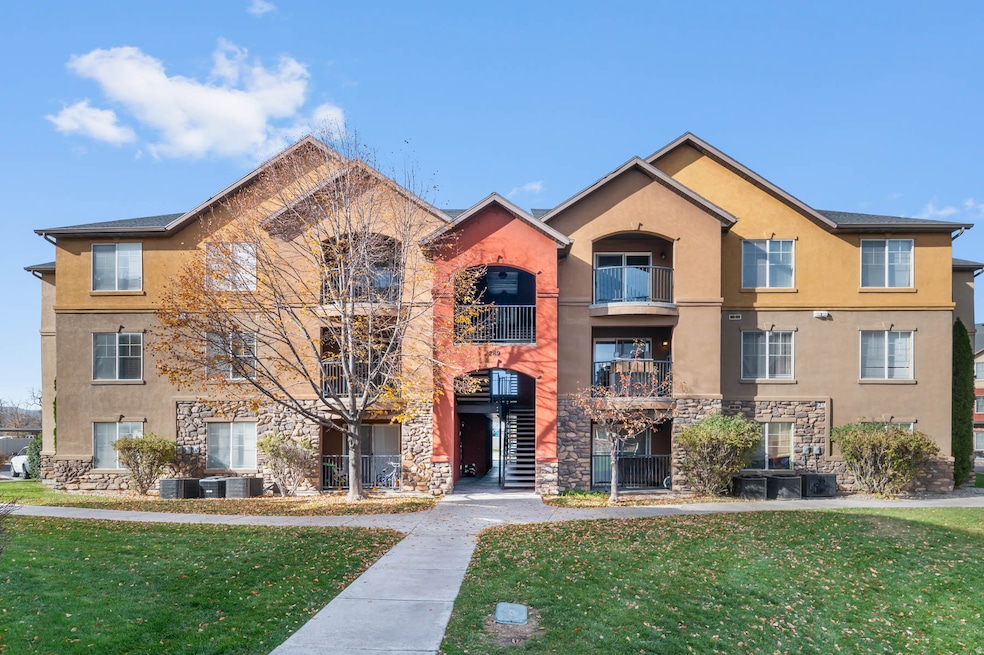
About This Home
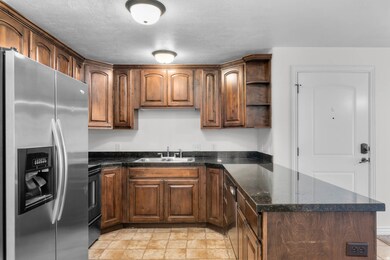
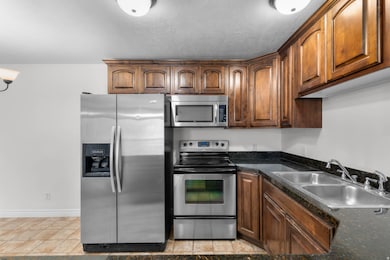
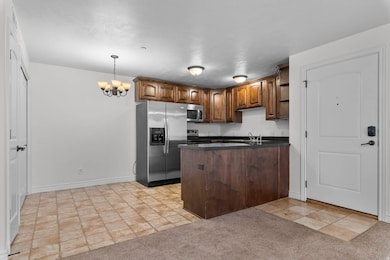
Welcome home to this beautifully updated condo, meticulously maintained with fresh, neutral paint throughout and newer, plush carpeting. This move-in ready unit is positioned in an unbeatable location, offering seamless access to the freeway, and just moments from a vibrant array of dining and retail options. The community boasts a spectacular clubhouse loaded with amenities: take a dip in the pool, skip your gym membership with the on-site fitness center, enjoy movie night in the theater room, or entertain guests in the common space. A unique opportunity: The Seller is willing to consider Seller Financing. Don't miss out on this perfect blend of location, amenities, and value.

Property Details
Home Type
- Condominium
Est. Annual Taxes
- $1,310
Year Built
- Built in 2007
Lot Details
- Partially Fenced Property
- Landscaped
- Sprinkler System
HOA Fees
- $350 Monthly HOA Fees
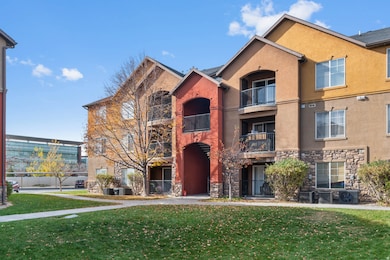
Home Design
- Stone Siding
- Stucco
Interior Spaces
- 1,180 Sq Ft Home
- 1-Story Property
- Double Pane Windows
- Mountain Views
- Electric Dryer Hookup
Kitchen
- Free-Standing Range
- Granite Countertops
- Disposal
Flooring
- Carpet
- Linoleum
Bedrooms and Bathrooms
- 3 Main Level Bedrooms
- Walk-In Closet
- 2 Full Bathrooms
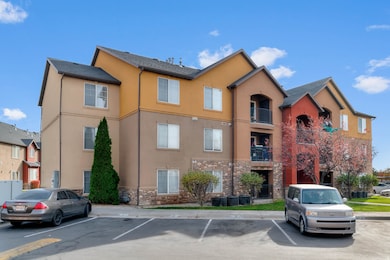
Parking
- 2 Open Parking Spaces
- 2 Parking Spaces
Outdoor Features
- Heated In Ground Pool
- Balcony
Schools
- Mount Mahogany Elementary School
- Pleasant Grove Middle School
- Pleasant Grove High School
Utilities
- Forced Air Heating and Cooling System
- Natural Gas Connected
- Sewer Paid
Listing and Financial Details
- Assessor Parcel Number 54-210-0043
Community Details
Overview
- Association fees include cable TV, insurance, ground maintenance, sewer, trash, water
- K&R Premier Association, Phone Number (801) 610-9440
- Maplewood Grove Subdivision
Amenities
- Community Barbecue Grill
- Picnic Area
- Clubhouse
Recreation
- Community Playground
- Community Pool
- Snow Removal
Pet Policy
- Pets Allowed
Map
Home Values in the Area
Average Home Value in this Area
Tax History
| Year | Tax Paid | Tax Assessment Tax Assessment Total Assessment is a certain percentage of the fair market value that is determined by local assessors to be the total taxable value of land and additions on the property. | Land | Improvement |
|---|---|---|---|---|
| 2025 | $1,344 | $156,310 | $31,600 | $252,600 |
| 2024 | $1,344 | $160,435 | $0 | $0 |
| 2023 | $1,306 | $159,500 | $0 | $0 |
| 2022 | $1,330 | $161,645 | $0 | $0 |
| 2021 | $1,168 | $216,100 | $25,900 | $190,200 |
| 2020 | $1,093 | $198,300 | $23,800 | $174,500 |
| 2019 | $961 | $180,300 | $21,000 | $159,300 |
| 2018 | $857 | $152,000 | $18,200 | $133,800 |
| 2017 | $751 | $70,950 | $0 | $0 |
| 2016 | $778 | $70,950 | $0 | $0 |
| 2015 | $822 | $70,950 | $0 | $0 |
| 2014 | $784 | $67,100 | $0 | $0 |
Property History
| Date | Event | Price | List to Sale | Price per Sq Ft |
|---|---|---|---|---|
| 11/18/2025 11/18/25 | Pending | -- | -- | -- |
| 11/12/2025 11/12/25 | For Sale | $299,000 | -- | $253 / Sq Ft |
Purchase History
| Date | Type | Sale Price | Title Company |
|---|---|---|---|
| Warranty Deed | -- | Utah First Title Ins Agency | |
| Warranty Deed | -- | 1St National Title Insuranc | |
| Warranty Deed | -- | Utah First Title Insurance |
Mortgage History
| Date | Status | Loan Amount | Loan Type |
|---|---|---|---|
| Open | $154,375 | No Value Available | |
| Previous Owner | $134,097 | FHA |
Source: UtahRealEstate.com
MLS Number: 2122532
APN: 54-210-0043
Disclaimer: Certain information contained herein is derived from information provided by parties other than Homes.com. All information provided is deemed reliable, but is not guaranteed to be accurate and should be independently verified.
![]() IDX information is provided exclusively for consumers’ personal, non-commercial use, that it may not be used for any purpose other than to identify prospective properties consumers may be interested in purchasing, and that the data is deemed reliable but is not guaranteed accurate by the MLS. Licensor is only providing the MLS Content and not other sources of data provided in the Product.
IDX information is provided exclusively for consumers’ personal, non-commercial use, that it may not be used for any purpose other than to identify prospective properties consumers may be interested in purchasing, and that the data is deemed reliable but is not guaranteed accurate by the MLS. Licensor is only providing the MLS Content and not other sources of data provided in the Product.
Based on information from the Wasatch Front Regional Multiple Listing Service, Inc.. All data, including all measurements and calculations of area, is obtained from various sources and has not been, and will not be, verified by broker or the MLS. All information should be independently reviewed and verified for accuracy. Properties may or may not be listed by the office/agent presenting the information.
- 317 S 1000 W Unit 104
- 278 S 740 W
- 383 S 790 W
- 165 S Pleasant Blvd Unit 45
- 963 W 670 S Unit 20
- 929 W 670 S Unit 9
- 1267 W 20 S
- 123 N Romney Ln Unit 103
- 1249 W Cambria Dr Unit 101
- 1406 W 50 N
- 150 N 1300 W
- 1429 W 110 N
- 1512 W 50 N
- 1559 W 50 N
- 264 W State St Unit 18
- 1542 W 110 N
- 1584 W 110 N
- 128 S 1700 W Unit 12
- The Hastings Plan at Tayside Farm - Townhome
- The Henley A Plan at Tayside Farm - Single Family Home