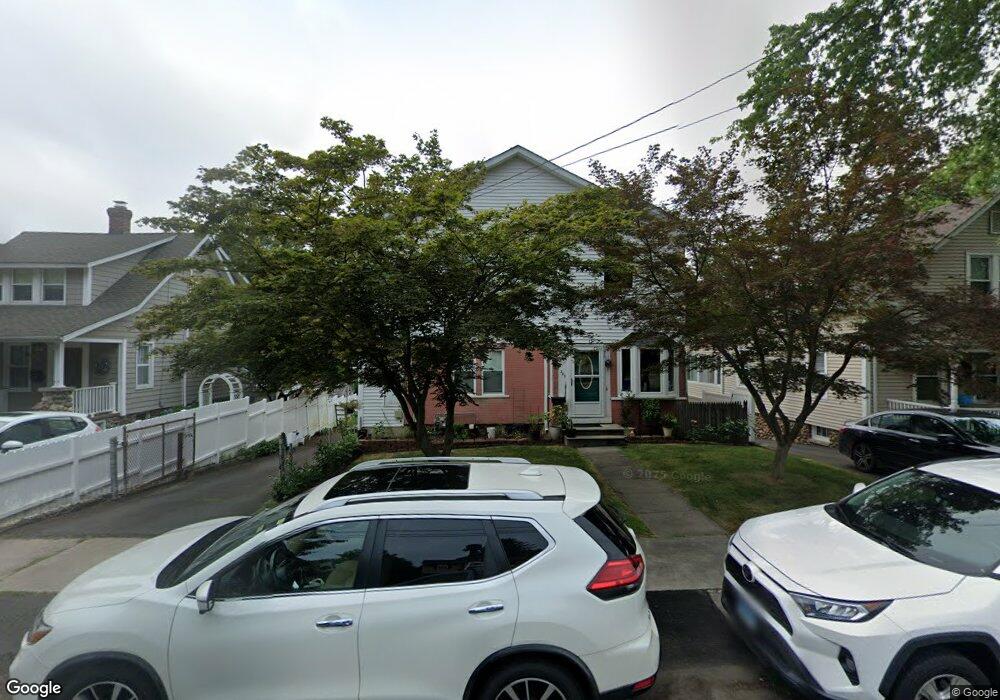
289 S Orchard St Wallingford, CT 06492
Estimated Value: $317,000 - $489,000
4
Beds
3
Baths
1,788
Sq Ft
$234/Sq Ft
Est. Value
About This Home
This home is located at 289 S Orchard St, Wallingford, CT 06492 and is currently estimated at $419,084, approximately $234 per square foot. 289 S Orchard St is a home located in New Haven County with nearby schools including Evarts C. Stevens School, Pond Hill Elementary School, and Dag Hammarskjold Middle School.
Ownership History
Date
Name
Owned For
Owner Type
Purchase Details
Closed on
Jul 16, 2002
Sold by
Delacruz Pascual and Delacruz Ramona
Bought by
Nilsen Steven D and Nilsen Beverly M
Current Estimated Value
Home Financials for this Owner
Home Financials are based on the most recent Mortgage that was taken out on this home.
Original Mortgage
$118,750
Interest Rate
6.79%
Create a Home Valuation Report for This Property
The Home Valuation Report is an in-depth analysis detailing your home's value as well as a comparison with similar homes in the area
Home Values in the Area
Average Home Value in this Area
Purchase History
| Date | Buyer | Sale Price | Title Company |
|---|---|---|---|
| Nilsen Steven D | $125,000 | -- | |
| Nilsen Steven D | $125,000 | -- |
Source: Public Records
Mortgage History
| Date | Status | Borrower | Loan Amount |
|---|---|---|---|
| Closed | Nilsen Steven D | $40,000 | |
| Closed | Nilsen Steven D | $124,000 | |
| Closed | Nilsen Steven D | $118,750 |
Source: Public Records
Tax History
| Year | Tax Paid | Tax Assessment Tax Assessment Total Assessment is a certain percentage of the fair market value that is determined by local assessors to be the total taxable value of land and additions on the property. | Land | Improvement |
|---|---|---|---|---|
| 2025 | $6,018 | $249,500 | $71,800 | $177,700 |
| 2024 | $5,252 | $171,300 | $59,900 | $111,400 |
| 2023 | $5,026 | $171,300 | $59,900 | $111,400 |
| 2022 | $4,975 | $171,300 | $59,900 | $111,400 |
| 2021 | $4,885 | $171,300 | $59,900 | $111,400 |
| 2020 | $5,380 | $184,300 | $63,800 | $120,500 |
| 2019 | $5,380 | $184,300 | $63,800 | $120,500 |
| 2018 | $5,278 | $184,300 | $63,800 | $120,500 |
| 2017 | $5,262 | $184,300 | $63,800 | $120,500 |
| 2016 | $5,140 | $184,300 | $63,800 | $120,500 |
| 2015 | $4,642 | $169,000 | $63,800 | $105,200 |
| 2014 | $4,356 | $162,000 | $63,800 | $98,200 |
Source: Public Records
Map
Nearby Homes
- 319 S Main St
- 303 S Elm St Unit 303
- 120 S Cherry St
- 137 Judd Square Unit 137
- 42 S Cherry St Unit 238
- 69 Terrace Gardens
- 57 Terrace Gardens Unit 57
- 27 Londonderry Dr
- 85 N Colony St
- 31 S Turnpike Rd Unit C2
- 30 Clinton Place
- 90 Masonic Ave
- 129 Brentwood Dr
- 229 Woodhouse Ave
- 3 Spice Hill Dr
- 61 Cheshire Rd
- 46 Walnut Ln
- 70 Putter Dr Unit 211
- 21 Putter Dr Unit 303S
- 16 Putter Dr Unit 207S
- 283 S Orchard St
- 293 S Orchard St
- 275 S Orchard St
- 267 S Orchard St
- 25 Pine St
- 286 S Orchard St
- 23 Parsons St
- 261 S Orchard St
- 261 S Orchard St Unit 1ST
- 292 S Orchard St
- 10 Crescent St
- 17 Parsons St
- 380 S Colony Rd
- 311 S Orchard St
- 278 S Orchard St
- 257 S Orchard St
- 300 S Orchard St
- 315 S Orchard St
- 46 Pine St
- 306 S Orchard St
Your Personal Tour Guide
Ask me questions while you tour the home.