289 Shifting Sands Rd Columbia, NC 27925
Estimated payment $594/month
Highlights
- Views of a Sound
- Corner Lot
- No HOA
- Home fronts a sound
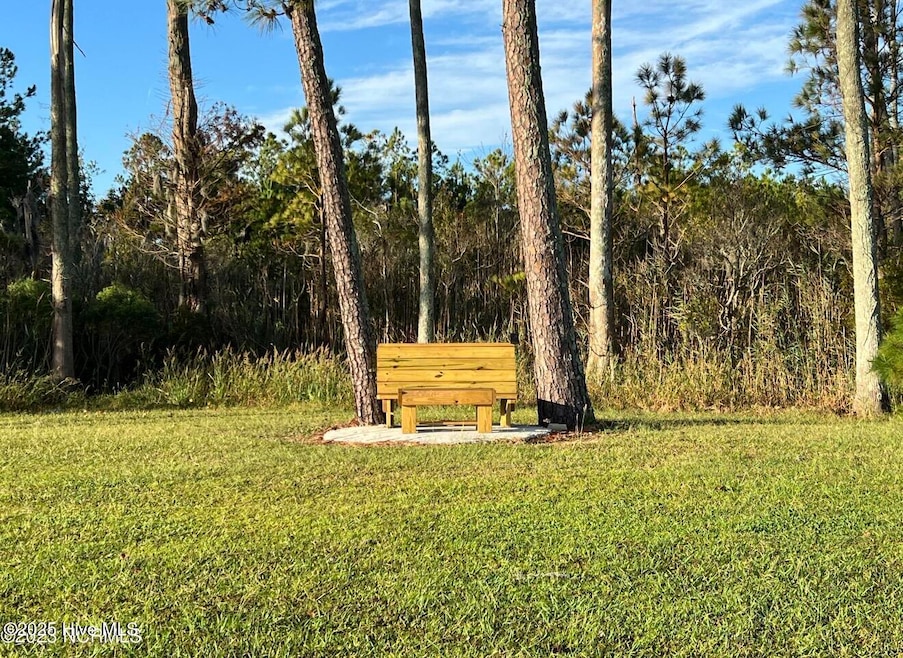
About This Lot
Come sit and enjoy the beautiful sunsets @ Osprey Point. This lot has 35 new loads of sand, a brand new driveway fence. This little slice of heaven would be the perfect beach getaway or your very own private home.
Property Details
Property Type
- Land
Est. Annual Taxes
- $171
Lot Details
- 2.3 Acre Lot
- Lot Dimensions are 100 x 188
- Home fronts a sound
- Corner Lot
- Cleared Lot
Property Views
- Views of a Sound
Schools
- Tyrrell Elementary School
- Columbia Middle School
- Columbia High School
Community Details
- No Home Owners Association
- The community has rules related to deed restrictions
Listing and Financial Details
- Assessor Parcel Number T071 06 004
Map
Home Values in the Area
Average Home Value in this Area
Tax History
| Year | Tax Paid | Tax Assessment Tax Assessment Total Assessment is a certain percentage of the fair market value that is determined by local assessors to be the total taxable value of land and additions on the property. | Land | Improvement |
|---|---|---|---|---|
| 2025 | $216 | $24,802 | $0 | $0 |
| 2024 | $171 | $18,019 | $5,120 | $12,899 |
| 2023 | $171 | $18,019 | $5,120 | $12,899 |
| 2022 | $171 | $18,019 | $5,120 | $12,899 |
| 2021 | $171 | $18,019 | $5,120 | $12,899 |
| 2020 | $169 | $18,019 | $5,120 | $12,899 |
| 2019 | $172 | $18,019 | $5,120 | $12,899 |
| 2018 | $151 | $18,019 | $5,120 | $12,899 |
| 2017 | $150 | $18,019 | $5,120 | $12,899 |
| 2016 | $306 | $44,335 | $5,120 | $39,215 |
| 2015 | $306 | $44,335 | $5,120 | $39,215 |
| 2014 | -- | $44,335 | $5,120 | $39,215 |
| 2013 | -- | $38,222 | $5,120 | $33,102 |
Property History
| Date | Event | Price | List to Sale | Price per Sq Ft |
|---|---|---|---|---|
| 11/17/2025 11/17/25 | Price Changed | $110,000 | -4.3% | -- |
| 10/22/2025 10/22/25 | Price Changed | $115,000 | -11.5% | -- |
| 09/29/2025 09/29/25 | For Sale | $130,000 | -- | -- |
Purchase History
| Date | Type | Sale Price | Title Company |
|---|---|---|---|
| Deed | $287,500 | -- |
Source: Hive MLS
MLS Number: 100533286
APN: T071-06-004
Disclaimer: Certain information contained herein is derived from information provided by parties other than Homes.com. All information provided is deemed reliable, but is not guaranteed to be accurate and should be independently verified.
![]() The data relating to real estate on this web site comes in part from the Internet Data Exchange program of Hive MLS LLC. All information is deemed reliable but not guaranteed and should be independently verified. All properties are subject to prior sale, change, or withdrawal. Neither listing broker(s) nor Homesnap, Inc. shall be responsible for any typographical errors, misinformation, or misprints, and shall be held totally harmless from any damages arising from reliance upon these data. ©2025 Hive MLS LLC
The data relating to real estate on this web site comes in part from the Internet Data Exchange program of Hive MLS LLC. All information is deemed reliable but not guaranteed and should be independently verified. All properties are subject to prior sale, change, or withdrawal. Neither listing broker(s) nor Homesnap, Inc. shall be responsible for any typographical errors, misinformation, or misprints, and shall be held totally harmless from any damages arising from reliance upon these data. ©2025 Hive MLS LLC
- 227 Rhodes Dr
- 122 Country Estate Unit Lot 28
- Lot 13 Country Estate
- Lot 12 Country Estate
- 148 Rhodes Dr
- 148 Rhodes Dr Unit Lot:1
- 348 Country Estate
- 348 Country Estate Unit Lot:18
- 330 Country Estates Rd Unit Lot: 19
- 106 Country Estates Unit Lot 31
- 2933 Sound Side Rd
- 87 Pearce Point Dr Unit Lot 4 & 5
- 87 Pearce Point Dr
- 41 East Rd
- 618 Taylor Beach Rd Unit Lot 14
- 324 Owens Ln
- 324 Owens Ln Unit Lot 4
- 85 Dana's Way
- 71 Dana's Way
- 88 Dana's Way
- 109 Neuse Cir
- 592 Arnolds Beach Rd
- 200 Dramtree Dr
- 315 Orchard Dr
- 303 Queenswood Blvd
- 204a Woodland Cr St
- 129 E Albemarle St Unit A
- 1870 Weeksville Rd
- 201 Hawthorne Rd
- 414 Harbor Bay Dr
- 207 Springvale St
- 1660 Warren Way
- 1510 Crescent Dr
- 1302 Highland Ave
- 828 Westway St
- 102 Osprey Cove
- 1100 W Williams Cir
- 406 Osprey Cove Unit 406
- 645 S Hughes Blvd
- 1221 Carolina Ave Unit 3d
