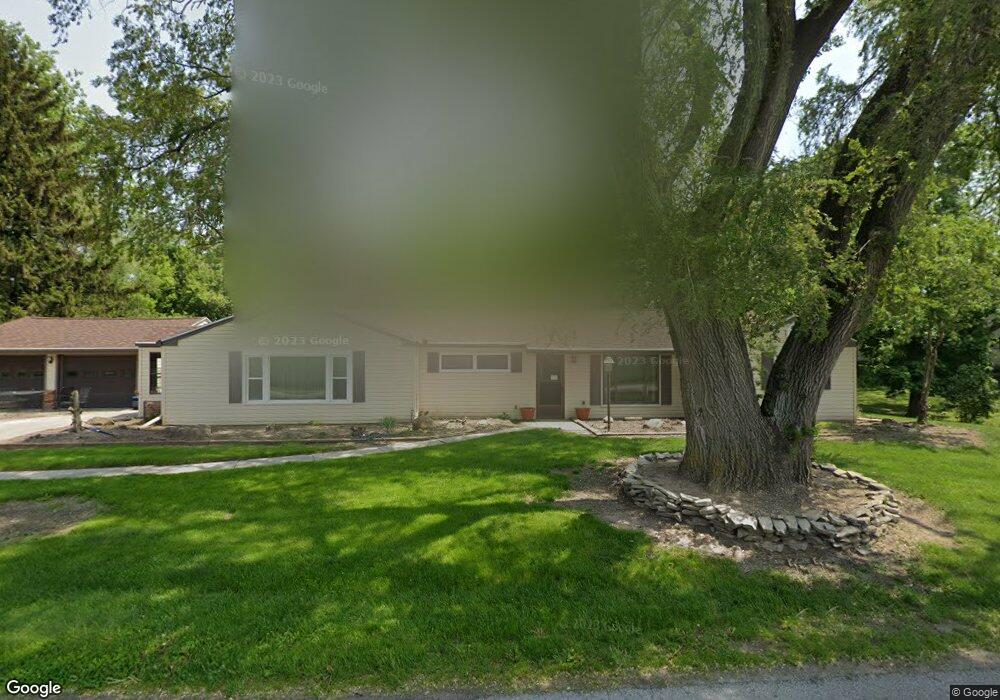
289 Swanton Ave Metamora, OH 43540
Estimated Value: $175,687 - $205,000
2
Beds
3
Baths
1,897
Sq Ft
$102/Sq Ft
Est. Value
About This Home
This home is located at 289 Swanton Ave, Metamora, OH 43540 and is currently estimated at $193,672, approximately $102 per square foot. 289 Swanton Ave is a home located in Fulton County with nearby schools including Evergreen Elementary School, Evergreen Middle School, and Evergreen High School.
Ownership History
Date
Name
Owned For
Owner Type
Purchase Details
Closed on
Mar 13, 2018
Sold by
Creque Gregory A and Gregory A Creque Revocable Tru
Bought by
Creque Steven E
Current Estimated Value
Purchase Details
Closed on
Aug 31, 2007
Sold by
Creque Greg
Bought by
Creque Gregory A and Gregory A Creque Revocable Trust
Purchase Details
Closed on
Apr 30, 2003
Sold by
Barnett Larry A and Barnett Diane S
Bought by
Creque Greg
Home Financials for this Owner
Home Financials are based on the most recent Mortgage that was taken out on this home.
Original Mortgage
$125,950
Outstanding Balance
$55,656
Interest Rate
6.02%
Mortgage Type
Purchase Money Mortgage
Estimated Equity
$138,016
Purchase Details
Closed on
Oct 6, 2000
Sold by
Marksch Robert L
Bought by
Barnett Larry A and Barnett Diane S
Home Financials for this Owner
Home Financials are based on the most recent Mortgage that was taken out on this home.
Original Mortgage
$137,700
Interest Rate
7.99%
Mortgage Type
VA
Purchase Details
Closed on
Jan 1, 1990
Bought by
Marksch Robert L
Create a Home Valuation Report for This Property
The Home Valuation Report is an in-depth analysis detailing your home's value as well as a comparison with similar homes in the area
Home Values in the Area
Average Home Value in this Area
Purchase History
| Date | Buyer | Sale Price | Title Company |
|---|---|---|---|
| Creque Steven E | -- | None Available | |
| Creque Gregory A | -- | Attorney | |
| Creque Greg | $157,500 | Northwest Title Agency Of Oh | |
| Barnett Larry A | $135,000 | -- | |
| Marksch Robert L | -- | -- |
Source: Public Records
Mortgage History
| Date | Status | Borrower | Loan Amount |
|---|---|---|---|
| Open | Creque Greg | $125,950 | |
| Previous Owner | Barnett Larry A | $137,700 |
Source: Public Records
Tax History Compared to Growth
Tax History
| Year | Tax Paid | Tax Assessment Tax Assessment Total Assessment is a certain percentage of the fair market value that is determined by local assessors to be the total taxable value of land and additions on the property. | Land | Improvement |
|---|---|---|---|---|
| 2024 | $1,574 | $41,940 | $9,630 | $32,310 |
| 2023 | $1,584 | $41,940 | $9,630 | $32,310 |
| 2022 | $1,678 | $36,130 | $8,020 | $28,110 |
| 2021 | $1,645 | $36,130 | $8,020 | $28,110 |
| 2020 | $1,628 | $36,130 | $8,020 | $28,110 |
| 2019 | $1,409 | $31,750 | $8,020 | $23,730 |
| 2018 | $719 | $31,750 | $8,020 | $23,730 |
| 2017 | $1,407 | $31,750 | $8,020 | $23,730 |
| 2016 | $1,191 | $27,800 | $8,020 | $19,780 |
| 2015 | $1,087 | $27,800 | $8,020 | $19,780 |
| 2014 | $1,094 | $27,800 | $8,020 | $19,780 |
| 2013 | $1,390 | $33,150 | $6,020 | $27,130 |
Source: Public Records
Map
Nearby Homes
- 14580 County Road 2
- 2674 US Highway 20
- 13490 State Route 64
- 13614 Hodges Hwy
- 5120 US Highway 20
- 5905 Ohio St
- 13001 Central Ave
- 11883 Sylvania-Metamora Rd
- 1400 N Fulton Lucas Rd
- 1102 N Fulton Lucas Rd
- 6803 County Rd N
- 10904 Sylvania Metamora Rd
- 2716 County Road L
- 3893 County Road L
- 8667 Thompson Hwy
- 11057 Arnold Hwy
- 7 359 County Road Rd W
- 10000 Mason Rd
- 13748 Yankee Rd
- 4327 Kilburn Rd