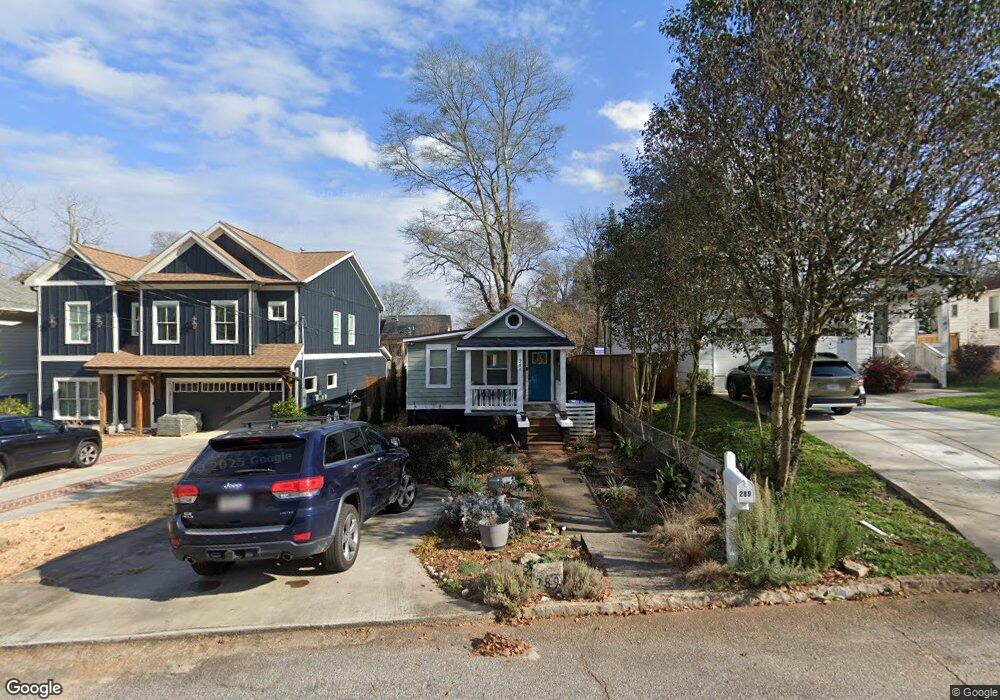
289 Third Ave Avondale Estates, GA 30002
Estimated Value: $343,451 - $392,000
3
Beds
1
Bath
784
Sq Ft
$472/Sq Ft
Est. Value
About This Home
This home is located at 289 Third Ave, Avondale Estates, GA 30002 and is currently estimated at $370,363, approximately $472 per square foot. 289 Third Ave is a home located in DeKalb County with nearby schools including Avondale Elementary School, Druid Hills Middle School, and Druid Hills High School.
Ownership History
Date
Name
Owned For
Owner Type
Purchase Details
Closed on
Aug 15, 2025
Sold by
Adams Meghan D
Bought by
Boulton Steven James and Free Lynsey Nicole
Current Estimated Value
Home Financials for this Owner
Home Financials are based on the most recent Mortgage that was taken out on this home.
Original Mortgage
$343,900
Outstanding Balance
$343,306
Interest Rate
6.75%
Mortgage Type
New Conventional
Estimated Equity
$27,057
Purchase Details
Closed on
Apr 27, 2012
Sold by
Holbrooks Pamela
Bought by
Adams Meghan D
Home Financials for this Owner
Home Financials are based on the most recent Mortgage that was taken out on this home.
Original Mortgage
$88,693
Interest Rate
4.01%
Mortgage Type
FHA
Purchase Details
Closed on
Jul 30, 2010
Sold by
Branch Bkng & Trust Co
Bought by
Holbrooks Pamela
Purchase Details
Closed on
Jul 4, 2009
Sold by
Tracy Jackie M
Bought by
Branch Bkng & Trust Co
Purchase Details
Closed on
Jan 27, 2004
Sold by
Advanced Dj Llc
Bought by
Tracy Jackie M
Home Financials for this Owner
Home Financials are based on the most recent Mortgage that was taken out on this home.
Original Mortgage
$100,000
Interest Rate
5.77%
Mortgage Type
New Conventional
Purchase Details
Closed on
Jul 1, 2003
Sold by
Thompson Julius O
Bought by
Citifinancial Mtg
Create a Home Valuation Report for This Property
The Home Valuation Report is an in-depth analysis detailing your home's value as well as a comparison with similar homes in the area
Home Values in the Area
Average Home Value in this Area
Purchase History
| Date | Buyer | Sale Price | Title Company |
|---|---|---|---|
| Boulton Steven James | $362,000 | -- | |
| Boulton Steven James | $362,000 | -- | |
| Adams Meghan D | $91,000 | -- | |
| Holbrooks Pamela | $8,500 | -- | |
| Branch Bkng & Trust Co | $11,050 | -- | |
| Tracy Jackie M | $135,000 | -- | |
| Citifinancial Mtg | $36,500 | -- |
Source: Public Records
Mortgage History
| Date | Status | Borrower | Loan Amount |
|---|---|---|---|
| Open | Boulton Steven James | $343,900 | |
| Previous Owner | Adams Meghan D | $88,693 | |
| Previous Owner | Tracy Jackie M | $100,000 |
Source: Public Records
Tax History
| Year | Tax Paid | Tax Assessment Tax Assessment Total Assessment is a certain percentage of the fair market value that is determined by local assessors to be the total taxable value of land and additions on the property. | Land | Improvement |
|---|---|---|---|---|
| 2025 | $3,244 | $131,520 | $45,920 | $85,600 |
| 2024 | $3,131 | $125,760 | $45,920 | $79,840 |
| 2023 | $3,131 | $126,160 | $25,000 | $101,160 |
| 2022 | $2,283 | $92,520 | $19,960 | $72,560 |
| 2021 | $2,131 | $85,920 | $9,960 | $75,960 |
| 2020 | $2,046 | $82,080 | $6,800 | $75,280 |
| 2019 | $1,474 | $57,480 | $6,800 | $50,680 |
| 2018 | $1,234 | $59,280 | $6,800 | $52,480 |
| 2017 | $1,236 | $46,360 | $6,680 | $39,680 |
| 2016 | $1,088 | $40,480 | $6,680 | $33,800 |
| 2014 | $624 | $20,400 | $6,680 | $13,720 |
Source: Public Records
Map
Nearby Homes
- 327 Ohm Ave
- 269 Ohm Ave
- 3143 Cedar St
- 3230 Rockbridge Rd SW
- 356 Creighton Ave
- 359 Marigna Ave
- 363 Marigna Ave
- 561 Cobblestone Trail
- 3156 Zion St
- 305 Cobblestone Trail
- 211 Cobblestone Trail Unit 211
- 301 Cobblestone Trail
- 3228 Chapel St
- 3215 Kelly St
- 3230 Kelly St
- 3076 Kelly St
- 443 Proctor Ave
- 461 Booker Ave
- 452 Booker Ave
- 3253 Blanton Dr
Your Personal Tour Guide
Ask me questions while you tour the home.