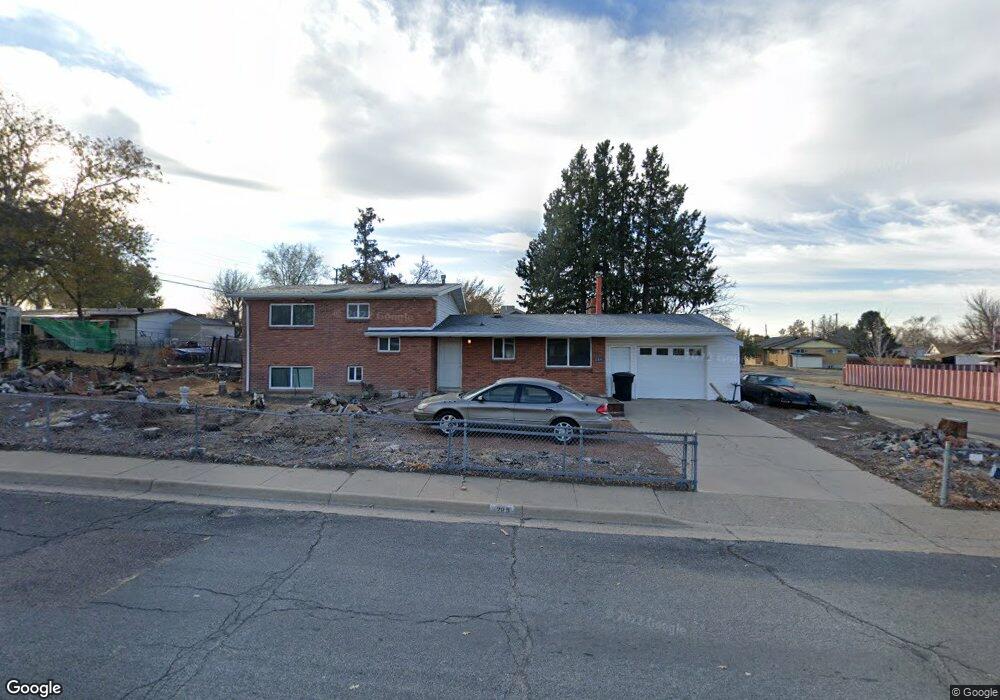
289 W 1150 N Clearfield, UT 84015
Estimated Value: $368,000 - $408,000
5
Beds
3
Baths
2,240
Sq Ft
$175/Sq Ft
Est. Value
About This Home
This home is located at 289 W 1150 N, Clearfield, UT 84015 and is currently estimated at $390,970, approximately $174 per square foot. 289 W 1150 N is a home located in Davis County with nearby schools including Doxey School, Sunset Junior High School, and Northridge High School.
Ownership History
Date
Name
Owned For
Owner Type
Purchase Details
Closed on
Jan 6, 2016
Sold by
Tsj Holdings Llc
Bought by
Hansen Benjamin J and Hansen Lorane N
Current Estimated Value
Purchase Details
Closed on
May 23, 2011
Sold by
Giles Edward Blaine
Bought by
Giles Edward Blaine and Gobady Rudy
Purchase Details
Closed on
Nov 4, 2005
Sold by
Fresh Leonard Fred
Bought by
Fresh Leonard Fresh and Giles Edward Blaine
Purchase Details
Closed on
Aug 15, 2005
Sold by
Fresh Leonard Fred
Bought by
Fresh Leonard Fred and Giles Edward Blaine
Create a Home Valuation Report for This Property
The Home Valuation Report is an in-depth analysis detailing your home's value as well as a comparison with similar homes in the area
Home Values in the Area
Average Home Value in this Area
Purchase History
| Date | Buyer | Sale Price | Title Company |
|---|---|---|---|
| Hansen Benjamin J | -- | First American Title | |
| Giles Edward Blaine | -- | None Available | |
| Fresh Leonard Fresh | -- | Equity Title Ins Agency Inc | |
| Fresh Leonard Fred | -- | Equity Title Ins Agency Inc |
Source: Public Records
Tax History Compared to Growth
Tax History
| Year | Tax Paid | Tax Assessment Tax Assessment Total Assessment is a certain percentage of the fair market value that is determined by local assessors to be the total taxable value of land and additions on the property. | Land | Improvement |
|---|---|---|---|---|
| 2025 | $2,207 | $201,301 | $71,429 | $129,872 |
| 2024 | $2,014 | $183,699 | $68,268 | $115,431 |
| 2023 | $1,882 | $172,150 | $59,935 | $112,214 |
| 2022 | $2,004 | $328,000 | $113,169 | $214,831 |
| 2021 | $1,746 | $247,000 | $67,462 | $179,538 |
| 2020 | $1,531 | $213,000 | $56,995 | $156,005 |
| 2019 | $1,303 | $186,000 | $71,742 | $114,258 |
| 2018 | $1,202 | $168,000 | $57,332 | $110,668 |
| 2016 | $1,071 | $76,890 | $27,112 | $49,778 |
| 2015 | $949 | $63,855 | $27,112 | $36,743 |
| 2014 | $924 | $64,217 | $27,112 | $37,105 |
| 2013 | -- | $64,460 | $23,265 | $41,195 |
Source: Public Records
Map
Nearby Homes