
Landlord's Agent in 2022
Kirk Glassel
The Charles Reinhart Company
(517) 812-7038
24 in this area
181 Total Sales
Estimated Value: $408,000 - $527,000
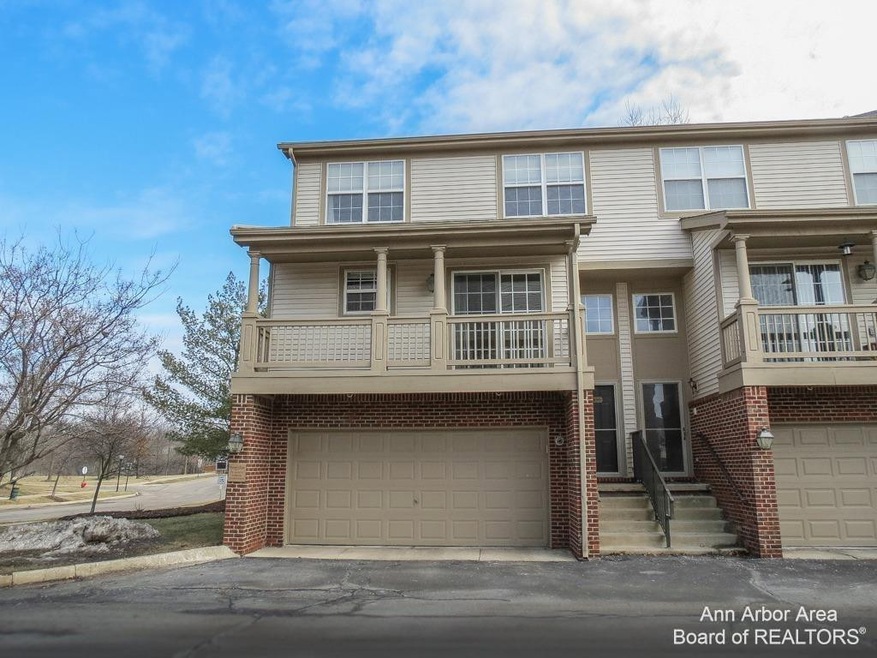
Nicely updated Hartford end unit floor plan in the highly desirable Barclay Park Condominium Community. Great location close to shopping, expressways, restaurants, and so much more! Unfortunately, there weren't any pictures taken with all of the updates.
Last Agent to Rent the Property
The Charles Reinhart Company License #6501384369 Listed on: 06/01/2022
| Date | Buyer | Sale Price | Title Company |
|---|---|---|---|
| Huang Mike | $364,000 | None Listed On Document | |
| Nason Michael | $282,000 | Liberty Title | |
| Chen Kuang Tsung | $210,000 | Liberty Title | |
| Shen Tsui Jane | $243,000 | -- | |
| Cendant Mobility Financial Corp | $255,500 | -- |
| Date | Status | Borrower | Loan Amount |
|---|---|---|---|
| Previous Owner | Nason Michael | $225,600 | |
| Previous Owner | Shen Tsui Jane | $80,000 |
| Date | Event | Price | List to Sale | Price per Sq Ft | Prior Sale |
|---|---|---|---|---|---|
| 06/01/2022 06/01/22 | Rented | $3,000 | 0.0% | -- | |
| 06/01/2022 06/01/22 | Under Contract | -- | -- | -- | |
| 06/01/2022 06/01/22 | For Rent | $3,000 | 0.0% | -- | |
| 03/25/2022 03/25/22 | Sold | $364,000 | +4.1% | $181 / Sq Ft | View Prior Sale |
| 03/25/2022 03/25/22 | Pending | -- | -- | -- | |
| 03/01/2022 03/01/22 | For Sale | $349,800 | +24.0% | $174 / Sq Ft | |
| 02/06/2017 02/06/17 | Sold | $282,000 | -2.7% | $140 / Sq Ft | View Prior Sale |
| 12/22/2016 12/22/16 | Pending | -- | -- | -- | |
| 10/17/2016 10/17/16 | For Sale | $289,900 | 0.0% | $144 / Sq Ft | |
| 07/01/2012 07/01/12 | Rented | $1,950 | 0.0% | -- | |
| 07/01/2012 07/01/12 | Under Contract | -- | -- | -- | |
| 04/26/2012 04/26/12 | For Rent | $1,950 | 0.0% | -- | |
| 04/20/2012 04/20/12 | Sold | $210,000 | -4.1% | $105 / Sq Ft | View Prior Sale |
| 04/08/2012 04/08/12 | Pending | -- | -- | -- | |
| 03/14/2012 03/14/12 | For Sale | $219,000 | -- | $109 / Sq Ft |
| Year | Tax Paid | Tax Assessment Tax Assessment Total Assessment is a certain percentage of the fair market value that is determined by local assessors to be the total taxable value of land and additions on the property. | Land | Improvement |
|---|---|---|---|---|
| 2025 | $8,921 | $193,300 | $0 | $0 |
| 2024 | $8,677 | $173,000 | $0 | $0 |
| 2023 | $8,012 | $153,400 | $0 | $0 |
| 2022 | $8,172 | $171,100 | $0 | $0 |
| 2021 | $7,979 | $171,900 | $0 | $0 |
| 2020 | $7,818 | $158,900 | $0 | $0 |
| 2019 | $7,440 | $150,900 | $150,900 | $0 |
| 2018 | $7,336 | $147,000 | $0 | $0 |
| 2017 | $5,791 | $145,500 | $0 | $0 |
| 2016 | $4,891 | $114,819 | $0 | $0 |
| 2015 | $6,813 | $114,476 | $0 | $0 |
| 2014 | $6,813 | $110,900 | $0 | $0 |
| 2013 | -- | $110,900 | $0 | $0 |
Landlord's Agent in 2022
Kirk Glassel
The Charles Reinhart Company
(517) 812-7038
24 in this area
181 Total Sales
Seller's Agent in 2022
David Mueller
Real Broker LLC Ann Arbor
(734) 646-1257
4 in this area
416 Total Sales
M
Seller Co-Listing Agent in 2022
Michael Dailey
Real Broker LLC Ann Arbor
(734) 368-4345
2 in this area
63 Total Sales
S
Tenant's Agent in 2022
Snow Liao
The Charles Reinhart Company
(734) 678-4848
7 in this area
43 Total Sales
Buyer's Agent in 2022
Jessy Glassel
The Charles Reinhart Company
(734) 883-3050
12 in this area
134 Total Sales
N
Seller's Agent in 2017
Nancy Milam
Keller Williams Dexter
Source: MichRIC
MLS Number: 23065567
APN: 09-10-400-042
Disclaimer: Certain information contained herein is derived from information provided by parties other than Homes.com. All information provided is deemed reliable, but is not guaranteed to be accurate and should be independently verified.
![]() Information is deemed reliable but not guaranteed.
Information is deemed reliable but not guaranteed.
Copyright 2025 MichRIC, LLC. All rights reserved.