Estimated Value: $54,000 - $210,000
--
Bed
1
Bath
1,755
Sq Ft
$91/Sq Ft
Est. Value
About This Home
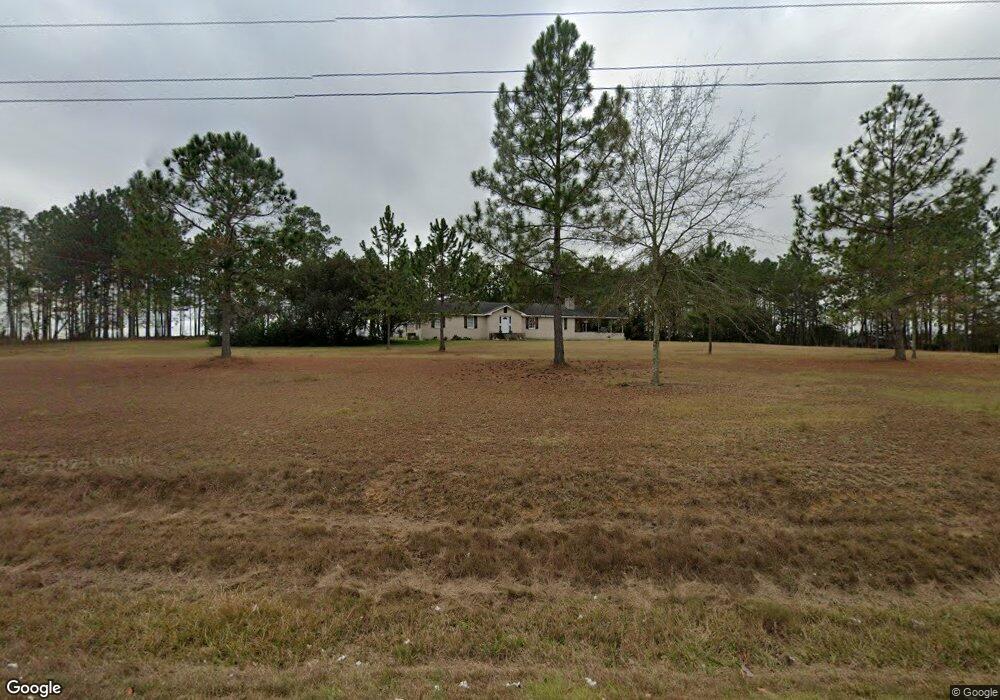
This home is located at 2890 Ga Highway 90, Arabi, GA 31712 and is currently estimated at $158,972, approximately $90 per square foot. 2890 Ga Highway 90 is a home located in Crisp County with nearby schools including Crisp County Primary School, Crisp County Elementary School, and Crisp County Middle School.
Ownership History
Date
Name
Owned For
Owner Type
Purchase Details
Closed on
Jul 31, 2014
Sold by
Findley William J
Bought by
Findley Jon Michael
Current Estimated Value
Purchase Details
Closed on
Jul 28, 2003
Sold by
Jackson Tracy
Bought by
Findley Wlliam J
Purchase Details
Closed on
Jul 10, 2003
Sold by
Ross Danny L
Bought by
Jackson Tracy
Purchase Details
Closed on
Apr 6, 2001
Sold by
Ross Tracy M
Bought by
Ross Danny L
Purchase Details
Closed on
May 31, 2000
Sold by
Ross Danny L
Bought by
Mixon Tracy M
Purchase Details
Closed on
Dec 2, 1999
Sold by
Ross Danny
Bought by
Mixon Tracy M
Purchase Details
Closed on
Oct 22, 1946
Bought by
Ross Danny
Create a Home Valuation Report for This Property
The Home Valuation Report is an in-depth analysis detailing your home's value as well as a comparison with similar homes in the area
Home Values in the Area
Average Home Value in this Area
Purchase History
| Date | Buyer | Sale Price | Title Company |
|---|---|---|---|
| Findley Jon Michael | -- | -- | |
| Findley Wlliam J | $31,200 | -- | |
| Jackson Tracy | -- | -- | |
| Ross Danny L | -- | -- | |
| Mixon Tracy M | -- | -- | |
| Mixon Tracy M | $45,000 | -- | |
| Ross Danny | $2,500 | -- |
Source: Public Records
Tax History Compared to Growth
Tax History
| Year | Tax Paid | Tax Assessment Tax Assessment Total Assessment is a certain percentage of the fair market value that is determined by local assessors to be the total taxable value of land and additions on the property. | Land | Improvement |
|---|---|---|---|---|
| 2024 | $1,487 | $54,911 | $9,483 | $45,428 |
| 2023 | $1,495 | $53,222 | $9,483 | $43,739 |
| 2022 | $1,386 | $49,351 | $7,302 | $42,049 |
| 2021 | $1,386 | $46,752 | $7,302 | $39,450 |
| 2020 | $1,388 | $46,752 | $7,302 | $39,450 |
| 2019 | $1,380 | $46,752 | $7,302 | $39,450 |
| 2018 | $1,248 | $40,750 | $9,146 | $31,604 |
| 2017 | $1,253 | $40,750 | $9,146 | $31,604 |
| 2016 | $1,251 | $40,750 | $9,146 | $31,604 |
| 2015 | -- | $40,750 | $9,146 | $31,604 |
| 2014 | -- | $40,750 | $9,146 | $31,604 |
| 2013 | -- | $39,159 | $9,146 | $30,013 |
Source: Public Records
Map
Nearby Homes
- 672 Brock Rd
- 2453 Georgia 90
- 846 Hawpond Rd
- 0 Lost Rd
- 114 Brier Patch Rd
- 3113 Old Hatley Rd
- 2905 Old Hatley Rd
- 1806 Georgia 90
- 2413 Old Hatley Rd
- 104 4th St
- 0 Aberdeen Circle Lt# 28
- 68 Aberdeen Cir
- 104 Aberdeen Cir
- TBD Aberdeen Circle Lot#28
- 221 1st St W
- 49 Aberdeen Cir
- 11 Lochridge Way
- 56 Aberdeen Cir
- Lot #13 Lakeview Dr
- 2874 Ga Highway 90
- 2883 S Highway 90 Hwy
- 2883 Ga Highway 90
- 1455 Arabi Williford Rd
- 5.91 ac Deep Creek Rd Tract 4
- 100 Deep Creek Rd
- 2837 Ga Highway 90
- 2863 Ga Highway 90
- 1361 Arabi Williford Rd
- 1395 Arabi Williford Rd
- 1317 Arabi Williford Rd
- 463 Brock Rd
- 485 Brock Rd
- 436 Brock Rd
- 210 Deep Creek Rd
- 407 Brock Rd
- Tract 4 Avery Rd
- 00 Avery Rd
- TRT 4&5 Avery Rd
- 1579 Arabi Williford Rd