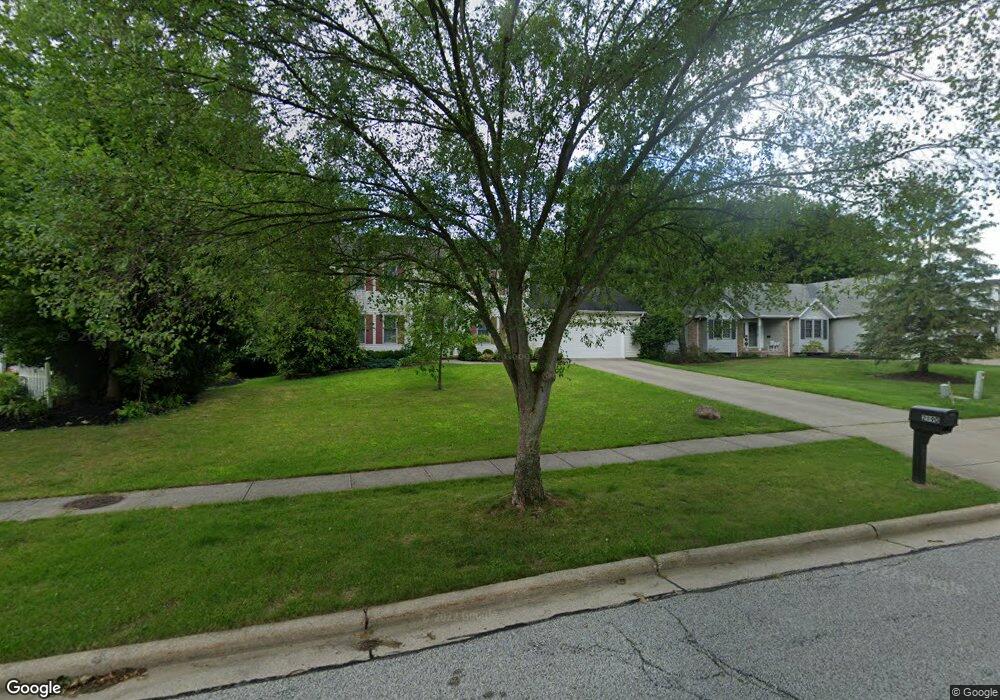
2890 Haggett Dr Twinsburg, OH 44087
Estimated Value: $355,830 - $450,000
3
Beds
3
Baths
1,360
Sq Ft
$287/Sq Ft
Est. Value
About This Home
This home is located at 2890 Haggett Dr, Twinsburg, OH 44087 and is currently estimated at $389,958, approximately $286 per square foot. 2890 Haggett Dr is a home located in Summit County with nearby schools including Wilcox Primary School, Dodge Intermediate School, and Samuel Bissell Elementary School.
Ownership History
Date
Name
Owned For
Owner Type
Purchase Details
Closed on
May 17, 2017
Sold by
Chan Shuit Ying
Bought by
Faber Kevin and Faber Lydia
Current Estimated Value
Home Financials for this Owner
Home Financials are based on the most recent Mortgage that was taken out on this home.
Original Mortgage
$184,000
Outstanding Balance
$153,019
Interest Rate
4.1%
Mortgage Type
New Conventional
Estimated Equity
$236,939
Purchase Details
Closed on
Jul 18, 2016
Sold by
Chan Shuit Ying and Chan Man Hoi
Bought by
Chan Shuit Ying
Purchase Details
Closed on
Jan 29, 1999
Sold by
Orwell Builders Inc
Bought by
Chan Man Hoi and Chan Shuit Ying
Home Financials for this Owner
Home Financials are based on the most recent Mortgage that was taken out on this home.
Original Mortgage
$80,000
Interest Rate
6.83%
Create a Home Valuation Report for This Property
The Home Valuation Report is an in-depth analysis detailing your home's value as well as a comparison with similar homes in the area
Home Values in the Area
Average Home Value in this Area
Purchase History
| Date | Buyer | Sale Price | Title Company |
|---|---|---|---|
| Faber Kevin | $230,000 | None Available | |
| Chan Shuit Ying | -- | None Available | |
| Chan Man Hoi | $195,800 | Chicago Title Insurance Comp |
Source: Public Records
Mortgage History
| Date | Status | Borrower | Loan Amount |
|---|---|---|---|
| Open | Faber Kevin | $184,000 | |
| Previous Owner | Chan Man Hoi | $80,000 |
Source: Public Records
Tax History Compared to Growth
Tax History
| Year | Tax Paid | Tax Assessment Tax Assessment Total Assessment is a certain percentage of the fair market value that is determined by local assessors to be the total taxable value of land and additions on the property. | Land | Improvement |
|---|---|---|---|---|
| 2025 | $4,750 | $98,707 | $25,515 | $73,192 |
| 2024 | $4,750 | $98,707 | $25,515 | $73,192 |
| 2023 | $4,750 | $98,707 | $25,515 | $73,192 |
| 2022 | $4,128 | $76,518 | $19,779 | $56,739 |
| 2021 | $4,147 | $76,518 | $19,779 | $56,739 |
| 2020 | $4,023 | $76,520 | $19,780 | $56,740 |
| 2019 | $4,039 | $71,800 | $19,780 | $52,020 |
| 2018 | $3,958 | $71,800 | $19,780 | $52,020 |
| 2017 | $2,944 | $71,800 | $19,780 | $52,020 |
| 2016 | $2,926 | $65,360 | $19,780 | $45,580 |
| 2015 | $2,944 | $65,360 | $19,780 | $45,580 |
| 2014 | $2,938 | $65,360 | $19,780 | $45,580 |
| 2013 | $2,961 | $65,860 | $19,780 | $46,080 |
Source: Public Records
Map
Nearby Homes
- 9740 Burton Dr
- 2668 Walton Blvd
- 2923 Alling Dr
- 3110 Blue Jaye Ln
- 2825 Veron Ln
- 10169 Timothy Ln
- 2590 Post Rd
- 3331 Shale Dr
- 10085 Glen Eagle Ln Unit 35AG
- 3281 Evans Way
- 10502 White Ash Trail
- 9933 Cynthia Dr
- 10240 Orchard Hill Ln Unit I23
- 10497 Kerwick Ct
- 3320 Blossom Trail
- 3336 Blossom Trail
- 3123 Killingworth Ln
- 10393 N Pond Ln
- 2708 Edgebrook Crossing Unit 19
- 10375 W Cobblestone Ln Unit 2
- 2894 Haggett Dr
- 2886 Haggett Dr
- 2898 Haggett Dr
- 2880 Sikes Ln
- 2856 Sikes Ln
- 2902 Haggett Dr
- 2889 Haggett Dr
- 2883 Haggett Dr
- 9187 Davis Way
- 2895 Haggett Dr
- 9195 Davis Way
- 2877 Haggett Dr
- 9203 Davis Way
- 9179 Davis Way
- 2852 Sikes Ln
- 2901 Haggett Dr
- 2906 Haggett Dr
- 9211 Davis Way
- 2871 Haggett Dr
- 2400 Champion Trail