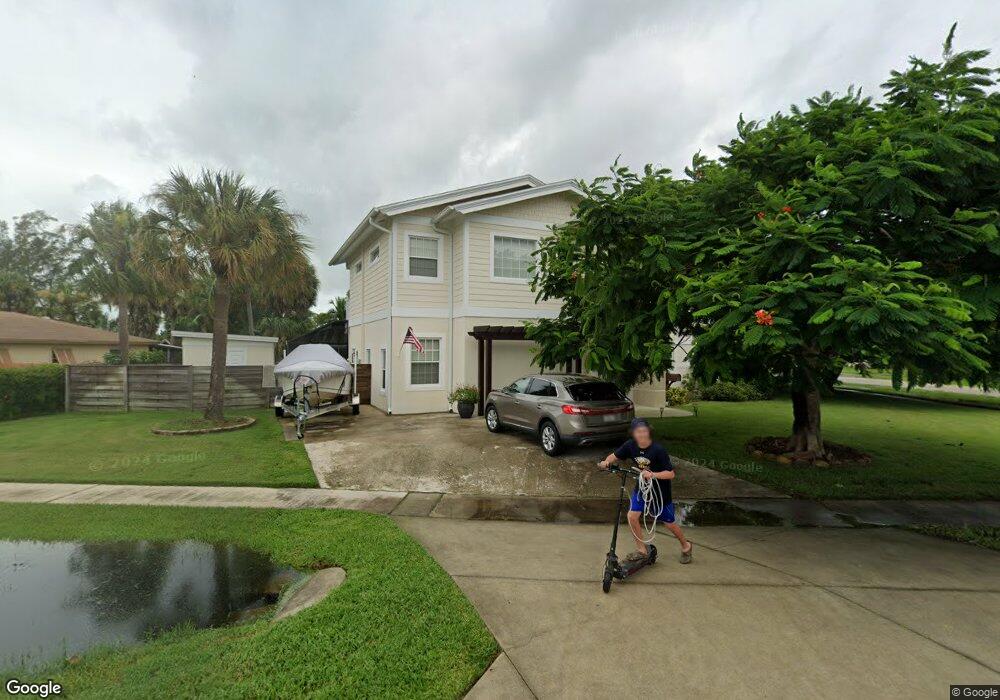
2890 Poinciana St Naples, FL 34105
Moorings Park-Hawks Ridge NeighborhoodEstimated Value: $548,000 - $749,000
--
Bed
--
Bath
1,668
Sq Ft
$387/Sq Ft
Est. Value
About This Home
This home is located at 2890 Poinciana St, Naples, FL 34105 and is currently estimated at $645,401, approximately $386 per square foot. 2890 Poinciana St is a home located in Collier County with nearby schools including Poinciana Elementary School, Naples High School, and Gulfview Middle School.
Ownership History
Date
Name
Owned For
Owner Type
Purchase Details
Closed on
Dec 3, 2003
Sold by
Carson Christopher K
Bought by
Carson Christopher K and Carson Suzette R
Current Estimated Value
Home Financials for this Owner
Home Financials are based on the most recent Mortgage that was taken out on this home.
Original Mortgage
$128,100
Outstanding Balance
$60,063
Interest Rate
6.05%
Mortgage Type
New Conventional
Estimated Equity
$585,338
Purchase Details
Closed on
Mar 14, 1997
Sold by
Housing & Urban Dev
Bought by
Carson Christopher K
Home Financials for this Owner
Home Financials are based on the most recent Mortgage that was taken out on this home.
Original Mortgage
$86,963
Interest Rate
7.75%
Mortgage Type
FHA
Purchase Details
Closed on
Dec 13, 1996
Sold by
Norwest Mtg Inc
Bought by
Housing & Urban Dev
Purchase Details
Closed on
Oct 8, 1996
Sold by
Clerk Circuit Court
Bought by
Norwest Mtg Inc
Create a Home Valuation Report for This Property
The Home Valuation Report is an in-depth analysis detailing your home's value as well as a comparison with similar homes in the area
Home Values in the Area
Average Home Value in this Area
Purchase History
| Date | Buyer | Sale Price | Title Company |
|---|---|---|---|
| Carson Christopher K | -- | -- | |
| Carson Christopher K | $86,200 | -- | |
| Housing & Urban Dev | -- | -- | |
| Norwest Mtg Inc | -- | -- |
Source: Public Records
Mortgage History
| Date | Status | Borrower | Loan Amount |
|---|---|---|---|
| Open | Carson Christopher K | $128,100 | |
| Previous Owner | Housing & Urban Dev | $31,800 | |
| Previous Owner | Housing & Urban Dev | $28,361 | |
| Previous Owner | Carson Christopher K | $86,963 |
Source: Public Records
Tax History Compared to Growth
Tax History
| Year | Tax Paid | Tax Assessment Tax Assessment Total Assessment is a certain percentage of the fair market value that is determined by local assessors to be the total taxable value of land and additions on the property. | Land | Improvement |
|---|---|---|---|---|
| 2025 | $2,197 | $246,475 | -- | -- |
| 2024 | $2,166 | $239,529 | -- | -- |
| 2023 | $2,166 | $232,552 | $0 | $0 |
| 2022 | $2,202 | $225,779 | $0 | $0 |
| 2021 | $2,218 | $219,203 | $0 | $0 |
| 2020 | $2,166 | $216,177 | $0 | $0 |
| 2019 | $2,125 | $211,317 | $0 | $0 |
| 2018 | $2,075 | $207,377 | $0 | $0 |
| 2017 | $2,039 | $203,112 | $0 | $0 |
| 2016 | $1,979 | $198,934 | $0 | $0 |
| 2015 | $1,162 | $124,010 | $0 | $0 |
| 2014 | $1,158 | $73,026 | $0 | $0 |
Source: Public Records
Map
Nearby Homes
- 2863 Coco Lakes Dr
- 2867 Coco Lakes Dr
- 3618 Cottage Club Ln
- 2847 Coco Lakes Dr
- 2600 Poinciana St
- 3511 Santiago Way
- 2590 Poinciana St
- 3088 Poinciana Dr
- 2564 Poinciana St
- 3523 Santiago Way
- 3393 Malaga Way
- 3338 Poinciana St
- 3586 Santiago Way
- 3325 Airport-Pulling Rd N Unit F1
- 3325 Airport Rd N Unit R3
- 3325 Airport Rd N Unit D3
- 3325 Airport Rd N Unit F3
- 2824 Poinciana St
- 2875 Poinciana Dr
- 3547 Poinciana St
- 2786 Poinciana St
- 3520 Dorado Way
- 2893 Poinciana Dr
- 2853 Poinciana Dr
- 2728 Poinciana St
- 2839 Poinciana St
- 2871 Poinciana St
- 3552 Poinciana St
- 2821 Poinciana St Unit 1
- 3529 Poinciana St
- 3508 Dorado Way
- 2839 Poinciana Dr
- 2793 Poinciana St
- 2901 Poinciana Dr
- 3511 Dorado Way
- 3530 Poinciana St
- 2912 Poinciana Dr