


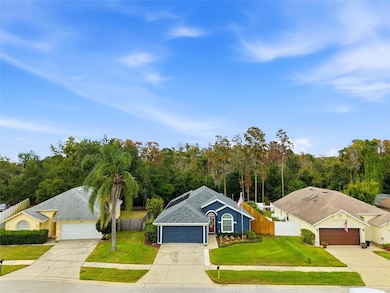
28907 Bay Tree Place Wesley Chapel, FL 33545
Estimated payment $2,142/month
Total Views
1,947
3
Beds
2
Baths
1,558
Sq Ft
$237
Price per Sq Ft
Highlights
- Hot Property
- Solar Power System
- Open Floorplan
- Screened Pool
- View of Trees or Woods
- Vaulted Ceiling
About This Home
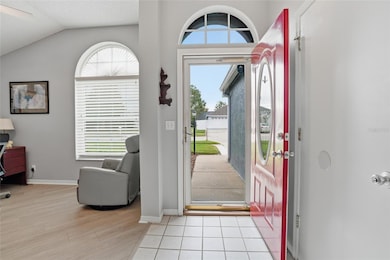
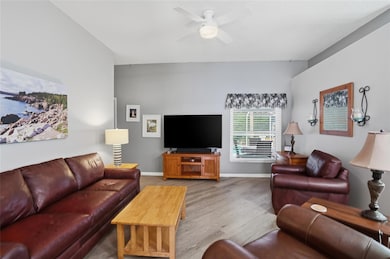
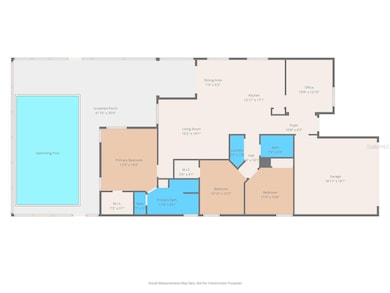
Stop scrolling and take a deep breath—you just found the peace of mind you have been looking for. In a market where "move-in ready" often comes with fine print, this 3-bedroom, 2-bath home in The Villages at Wesley Chapel is the real deal. We have handled the big scary stuff for you: this home features a new roof and brand-new plumbing. That means you can stop worrying about insurance inspections and start planning your first pool party. The home offers a comfortable 1,558 square feet of living space that feels open and practical for daily life. The split floor plan gives everyone their own corner of the world, while the central living areas bring the family together. But let’s be honest, you are living in Florida for the outdoors. Step back into your private, screen-enclosed pool area. It is the perfect spot for morning coffee or unwinding after a long week, all without battling the bugs. You also have a spacious 2-car garage for the cars (or let’s be real, the storage bins) and a yard that is manageable but big enough for the dog to run. You are minutes from the interstate, top-rated schools, and the shopping at Wiregrass, but tucked away enough to enjoy the quiet. Homes with these major updates do not sit long, even in this market. Come see why this is the smartest buy you will make this year.
Listing Agent
RE/MAX PREMIER GROUP Brokerage Phone: 813-929-7600 License #3265276 Listed on: 12/03/2025
Home Details
Home Type
- Single Family
Est. Annual Taxes
- $2,052
Year Built
- Built in 1994
Lot Details
- 7,617 Sq Ft Lot
- South Facing Home
- Wood Fence
- Mature Landscaping
- Metered Sprinkler System
- Property is zoned R4
HOA Fees
- $32 Monthly HOA Fees
Parking
- 2 Car Attached Garage
- Garage Door Opener
Property Views
- Woods
- Pool
Home Design
- Florida Architecture
- Patio Home
- Slab Foundation
- Shingle Roof
- Membrane Roofing
- Concrete Siding
- Stucco
Interior Spaces
- 1,558 Sq Ft Home
- Open Floorplan
- Vaulted Ceiling
- Ceiling Fan
- Double Pane Windows
- ENERGY STAR Qualified Windows
- Insulated Windows
- Shades
- Blinds
- Sliding Doors
- Family Room Off Kitchen
- Living Room
- Dining Room
- Home Office
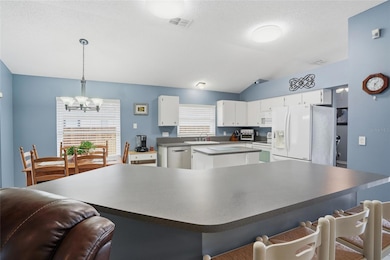
Kitchen
- Range
- Microwave
- Ice Maker
- Dishwasher
- Solid Surface Countertops
- Disposal
Flooring
- Laminate
- Tile
- Luxury Vinyl Tile
Bedrooms and Bathrooms
- 3 Bedrooms
- Primary Bedroom on Main
- Split Bedroom Floorplan
- Walk-In Closet
- 2 Full Bathrooms
- Low Flow Plumbing Fixtures
Laundry
- Laundry Room
- Dryer
- Washer
Home Security
- Home Security System
- Fire and Smoke Detector
Eco-Friendly Details
- Non-Toxic Pest Control
- Solar Power System
- HVAC Cartridge or Media Filter
- HVAC UV or Electric Filtration
- HVAC Filter MERV Rating 8+
- Whole House Water Purification
Pool
- Screened Pool
- Solar Heated In Ground Pool
- Gunite Pool
- Saltwater Pool
- Green energy used to heat the pool or spa
- Fence Around Pool
- Pool has a Solar Cover
- Solar Power Pool Pump
- Chlorine Free
- Auto Pool Cleaner
- Pool Lighting
Outdoor Features
- Enclosed Patio or Porch
- Rain Gutters
Schools
- Quail Hollow Elementary School
- Thomas E Weightman Middle School
- Wesley Chapel High School
Utilities
- Central Air
- Heat Pump System
- Thermostat
- Underground Utilities
- Water Filtration System
- Electric Water Heater
- Water Softener
- High Speed Internet
- Phone Available
- Cable TV Available
Community Details
- Staff Secretary Association, Phone Number (813) 973-0820
- Visit Association Website
- Villages At Wesley Chapel Subdivision
- The community has rules related to deed restrictions
- Near Conservation Area
Listing and Financial Details
- Visit Down Payment Resource Website
- Legal Lot and Block 17 / 4
- Assessor Parcel Number 07-26-20-0030-00400-0170
Map
Create a Home Valuation Report for This Property
The Home Valuation Report is an in-depth analysis detailing your home's value as well as a comparison with similar homes in the area
Home Values in the Area
Average Home Value in this Area
Tax History
| Year | Tax Paid | Tax Assessment Tax Assessment Total Assessment is a certain percentage of the fair market value that is determined by local assessors to be the total taxable value of land and additions on the property. | Land | Improvement |
|---|---|---|---|---|
| 2025 | $2,052 | $155,860 | -- | -- |
| 2024 | $2,052 | $147,210 | -- | -- |
| 2023 | $1,968 | $142,930 | $0 | $0 |
| 2022 | $1,763 | $138,770 | $0 | $0 |
| 2021 | $1,721 | $134,730 | $49,133 | $85,597 |
| 2020 | $1,688 | $132,870 | $39,611 | $93,259 |
| 2019 | $1,652 | $129,890 | $0 | $0 |
| 2018 | $1,615 | $127,476 | $0 | $0 |
| 2017 | $1,604 | $127,476 | $0 | $0 |
| 2016 | $1,543 | $122,286 | $0 | $0 |
| 2015 | $1,563 | $121,436 | $0 | $0 |
| 2014 | $1,517 | $137,385 | $38,697 | $98,688 |
Source: Public Records
Property History
| Date | Event | Price | List to Sale | Price per Sq Ft |
|---|---|---|---|---|
| 12/03/2025 12/03/25 | For Sale | $369,900 | -- | $237 / Sq Ft |
Source: Stellar MLS
Purchase History
| Date | Type | Sale Price | Title Company |
|---|---|---|---|
| Interfamily Deed Transfer | -- | Attorney | |
| Quit Claim Deed | $100 | -- | |
| Warranty Deed | $103,300 | -- |
Source: Public Records
Mortgage History
| Date | Status | Loan Amount | Loan Type |
|---|---|---|---|
| Open | $73,000 | New Conventional | |
| Previous Owner | $73,000 | Purchase Money Mortgage |
Source: Public Records
About the Listing Agent
Providing Exceptional Real Estate Service with Front Porch Hospitality
With over a decade of real estate experience, Adam Grenville is a trusted name in the Wesley Chapel and greater Tampa Bay area. As a REALTOR® with RE/MAX Premier Group, Adam brings a powerful mix of local market knowledge, proven negotiation skills, and a commitment to delivering exceptional service that feels as welcoming as a front porch conversation.
Adam specializes in residential real estate — helping
Adam's Other Listings
Source: Stellar MLS
MLS Number: TB8452317
APN: 07-26-20-0030-00400-0170
Disclaimer: Certain information contained herein is derived from information provided by parties other than Homes.com. All information provided is deemed reliable, but is not guaranteed to be accurate and should be independently verified.
![]() IDX information is provided exclusively for personal, non-commercial use, and may not be used for any purpose other than to identify prospective properties consumers may be interested in purchasing. Information is deemed reliable but not guaranteed.
IDX information is provided exclusively for personal, non-commercial use, and may not be used for any purpose other than to identify prospective properties consumers may be interested in purchasing. Information is deemed reliable but not guaranteed.
Listing Information presented by local MLS brokerage: Ten-X - (888)-952-6393
Nearby Homes
- 6038 Wesley Brook Dr
- 28616 Tupper Rd
- 28632 Seashell Ct
- 6048 Sand Key Ln
- 7727 Bronze Oak Dr
- 33181 Rosewood Bark Way
- 5667 Chorleywood Ln
- 33548 Elm Hill Branch
- 6131 Sand Key Ln
- 28536 Tupper Rd
- 6142 Caroline Dr
- 5454 Saddlebrook Way Unit 2
- 5444 Saddlebrook Way Unit 4
- 5808 Carina Trace
- 5434 Saddlebrook Way Unit 3
- 32226 Eldorado Canyon Loop
- 6218 Bridleford Dr
- 29318 Whipporwill Ln
- 29523 Chapel Park Dr
- 5243 Foxhunt Dr
- 28739 Raleigh Place
- 28651 Seashell Ct
- 5667 Chorleywood Ln
- 5989 Timberdale Ave
- 9476 Seagrass Port Pass
- 5675 Chorleywood Ln
- 6274 Caroline Dr
- 5427 Villa Deste Ct
- 6401 Emmy Ln
- 2546 Warren Acres Blvd
- 6674 Halo Bend Ct
- 5019 Mill Pond Rd Unit 3190
- 5146 Londonderry Ln
- 5020 Mill Pond Rd Unit 3 Bedroom
- 4947 Mill Pond Rd Unit 3107
- 4946 Mill Pond Rd Unit 3178
- 29129 Bay Hollow Dr Unit 2800
- 29147 Bay Hollow Dr Unit 3279
- 29130 Bay Hollow Dr Unit 2 Bedroom Condo
- 29230 Bay Hollow Dr Unit 3283