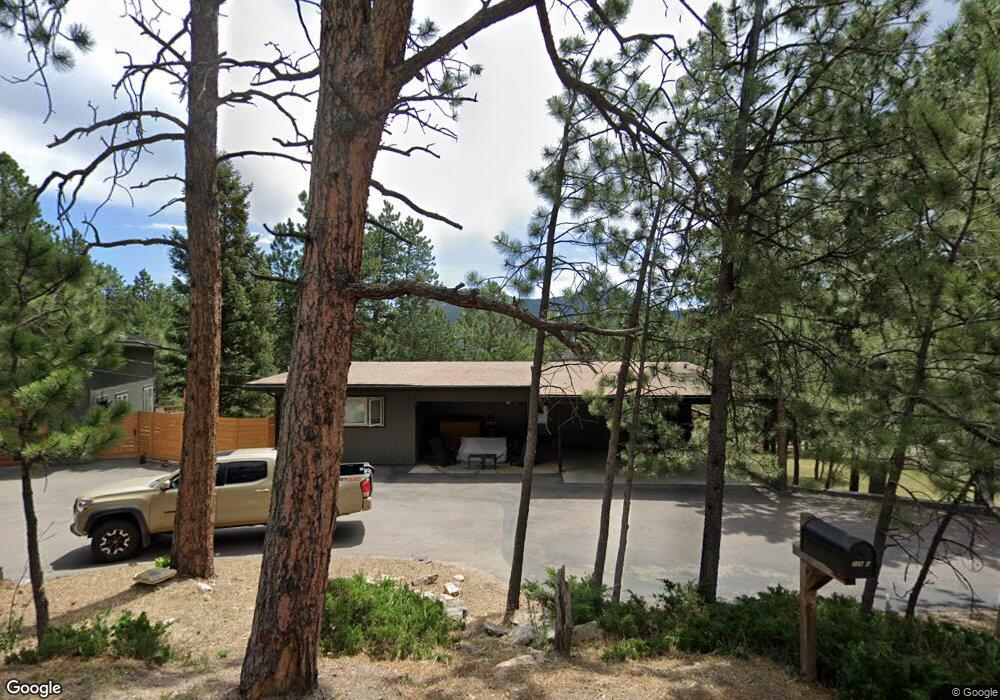
28908 Cedar Cir Evergreen, CO 80439
Hiwan Hills NeighborhoodEstimated Value: $798,098 - $931,000
4
Beds
3
Baths
2,868
Sq Ft
$299/Sq Ft
Est. Value
About This Home
This home is located at 28908 Cedar Cir, Evergreen, CO 80439 and is currently estimated at $857,025, approximately $298 per square foot. 28908 Cedar Cir is a home located in Jefferson County with nearby schools including Bergen Meadow Primary School, Bergen Valley Intermediate School, and Evergreen Middle School.
Ownership History
Date
Name
Owned For
Owner Type
Purchase Details
Closed on
Oct 14, 2016
Sold by
Fierst Sean
Bought by
Fierst Sean and Fierst Tania Nicole
Current Estimated Value
Purchase Details
Closed on
Dec 13, 2012
Sold by
Miller Patricia Kay
Bought by
Fierst Sean
Home Financials for this Owner
Home Financials are based on the most recent Mortgage that was taken out on this home.
Original Mortgage
$352,695
Outstanding Balance
$248,688
Interest Rate
3.75%
Mortgage Type
FHA
Estimated Equity
$608,337
Purchase Details
Closed on
Aug 15, 2012
Sold by
Ozog Agnes W
Bought by
Miller Patricia Kay
Home Financials for this Owner
Home Financials are based on the most recent Mortgage that was taken out on this home.
Original Mortgage
$255,725
Interest Rate
3.63%
Mortgage Type
FHA
Purchase Details
Closed on
Jul 2, 2009
Sold by
Ozog Agnes W
Bought by
Francis J Ozog Trust
Create a Home Valuation Report for This Property
The Home Valuation Report is an in-depth analysis detailing your home's value as well as a comparison with similar homes in the area
Home Values in the Area
Average Home Value in this Area
Purchase History
| Date | Buyer | Sale Price | Title Company |
|---|---|---|---|
| Fierst Sean | -- | None Available | |
| Fierst Sean | $280,000 | Land Title Guarantee Company | |
| Miller Patricia Kay | $265,000 | Chicago Title Co | |
| Francis J Ozog Trust | -- | None Available |
Source: Public Records
Mortgage History
| Date | Status | Borrower | Loan Amount |
|---|---|---|---|
| Open | Fierst Sean | $352,695 | |
| Previous Owner | Miller Patricia Kay | $255,725 |
Source: Public Records
Tax History
| Year | Tax Paid | Tax Assessment Tax Assessment Total Assessment is a certain percentage of the fair market value that is determined by local assessors to be the total taxable value of land and additions on the property. | Land | Improvement |
|---|---|---|---|---|
| 2024 | $4,096 | $44,663 | $10,780 | $33,883 |
| 2023 | $4,096 | $44,663 | $10,780 | $33,883 |
| 2022 | $3,670 | $38,850 | $12,986 | $25,864 |
| 2021 | $3,708 | $39,968 | $13,360 | $26,608 |
| 2020 | $4,054 | $43,361 | $19,282 | $24,079 |
| 2019 | $3,998 | $43,361 | $19,282 | $24,079 |
| 2018 | $2,846 | $29,853 | $8,254 | $21,599 |
| 2017 | $2,591 | $29,853 | $8,254 | $21,599 |
| 2016 | $2,602 | $28,771 | $10,455 | $18,316 |
| 2015 | $2,581 | $28,771 | $10,455 | $18,316 |
| 2014 | $2,581 | $26,961 | $12,530 | $14,431 |
Source: Public Records
Map
Nearby Homes
- 28609 Pine Dr
- 4148 Timbervale Dr
- 28964 Western Dr
- 28449 Douglas Park Rd
- 4125 Aspen Ln
- 27972 Meadow Dr Unit 220
- 27972 Meadow Dr Unit 320
- 27972 Meadow Dr Unit 210
- 27972 Meadow Dr Unit 310
- 27972 Meadow Dr Unit 120
- 4266 Troutdale Village Dr
- 29859 Park Village Dr
- 27901 Pine Dr
- 27906 Lupine Dr
- 4812 S Cedar Rd
- 3886 Ponderosa Dr
- 29310 Buchanan Dr
- 3942 S Palo Verde Rd
- 4865 Silver Spruce Ln
- 29359 Buchanan Dr
- 28753 Meadow Dr
- 28898 Cedar Cir
- 28907 Cedar Cir
- 28754 Meadow Dr
- 28790 Pine Dr
- 28888 Cedar Cir
- 28653 Meadow Dr
- 28897 Cedar Cir
- 28760 Pine Dr
- 28877 Cedar Cir
- 29045 Douglas Park Rd
- 29035 Douglas Park Rd
- 28878 Cedar Cir
- 28654 Meadow Dr
- 28759 Douglas Park Rd
- 28659 Pine Dr
- 28887 Cedar Cir
- 4250 Aspen Ln
- 28660 Pine Dr
- 28613 Meadow Dr
Your Personal Tour Guide
Ask me questions while you tour the home.