Estimated Value: $327,000 - $362,000
3
Beds
1
Bath
950
Sq Ft
$361/Sq Ft
Est. Value
About This Home
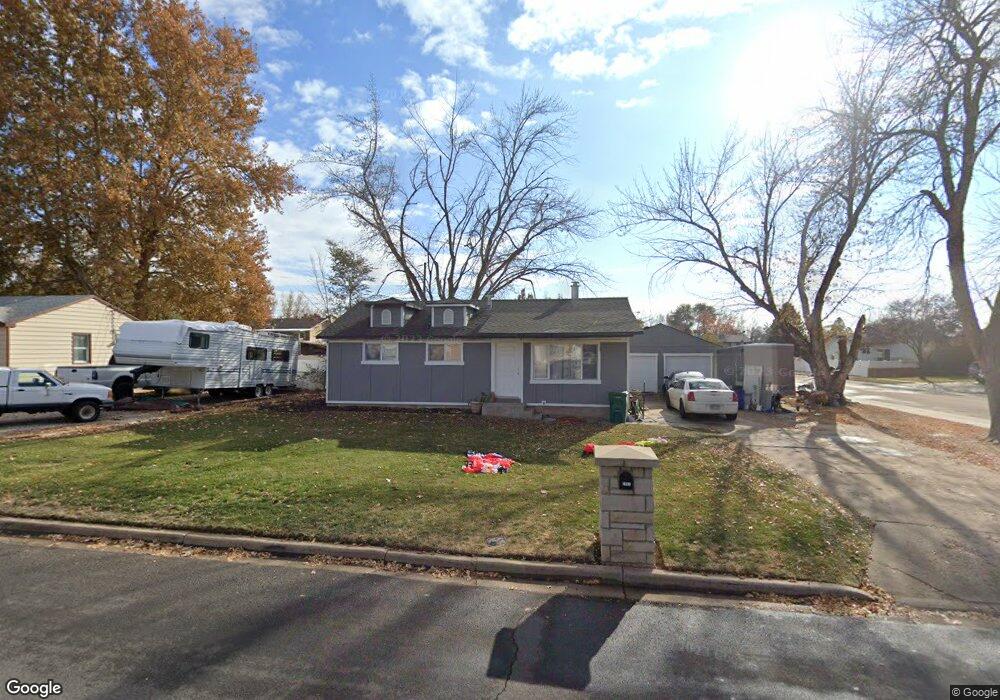
This home is located at 2891 W 5725 S, Roy, UT 84067 and is currently estimated at $343,199, approximately $361 per square foot. 2891 W 5725 S is a home located in Weber County with nearby schools including Roy Elementary School, Roy Junior High School, and Roy High School.
Ownership History
Date
Name
Owned For
Owner Type
Purchase Details
Closed on
Feb 18, 2022
Sold by
Godinez Gallegos Carolyn
Bought by
Godinez Carolyn
Current Estimated Value
Home Financials for this Owner
Home Financials are based on the most recent Mortgage that was taken out on this home.
Original Mortgage
$234,000
Outstanding Balance
$217,287
Interest Rate
3.55%
Mortgage Type
New Conventional
Estimated Equity
$125,912
Purchase Details
Closed on
Feb 4, 2020
Sold by
Gallegos Carolyn Godinez
Bought by
Gallegos Carolyn Godinez and Santos Edgar Reyna
Home Financials for this Owner
Home Financials are based on the most recent Mortgage that was taken out on this home.
Original Mortgage
$188,137
Interest Rate
4.25%
Mortgage Type
FHA
Purchase Details
Closed on
Jul 29, 2011
Sold by
Roane Ted Duke and Roane Jan G
Bought by
The Orange House Llc
Purchase Details
Closed on
Oct 25, 2000
Sold by
Roane Cary D and Roane Donna M
Bought by
Roane Ted Duke and Roane Jan G
Create a Home Valuation Report for This Property
The Home Valuation Report is an in-depth analysis detailing your home's value as well as a comparison with similar homes in the area
Home Values in the Area
Average Home Value in this Area
Purchase History
| Date | Buyer | Sale Price | Title Company |
|---|---|---|---|
| Godinez Carolyn | -- | None Listed On Document | |
| Gallegos Carolyn Godinez | -- | Accommodation | |
| Gallegos Carolyn Godinez | -- | Real Advantage Title Ins Ag | |
| The Orange House Llc | -- | None Available | |
| Roane Ted Duke | -- | The Home Abstract & Title Co |
Source: Public Records
Mortgage History
| Date | Status | Borrower | Loan Amount |
|---|---|---|---|
| Open | Godinez Carolyn | $234,000 | |
| Previous Owner | Gallegos Carolyn Godinez | $188,137 |
Source: Public Records
Tax History
| Year | Tax Paid | Tax Assessment Tax Assessment Total Assessment is a certain percentage of the fair market value that is determined by local assessors to be the total taxable value of land and additions on the property. | Land | Improvement |
|---|---|---|---|---|
| 2025 | $1,985 | $302,212 | $128,384 | $173,828 |
| 2024 | $1,943 | $163,899 | $70,626 | $93,273 |
| 2023 | $1,926 | $163,350 | $67,930 | $95,420 |
| 2022 | $1,857 | $161,700 | $57,766 | $103,934 |
| 2021 | $1,490 | $211,000 | $68,670 | $142,330 |
| 2020 | $1,319 | $170,000 | $68,670 | $101,330 |
| 2019 | $1,350 | $165,000 | $42,946 | $122,054 |
| 2018 | $1,342 | $155,000 | $39,932 | $115,068 |
| 2017 | $1,197 | $127,723 | $38,562 | $89,161 |
| 2016 | $1,142 | $65,307 | $19,890 | $45,417 |
| 2015 | $1,009 | $58,093 | $19,890 | $38,203 |
| 2014 | $969 | $54,804 | $19,890 | $34,914 |
Source: Public Records
Map
Nearby Homes
Your Personal Tour Guide
Ask me questions while you tour the home.