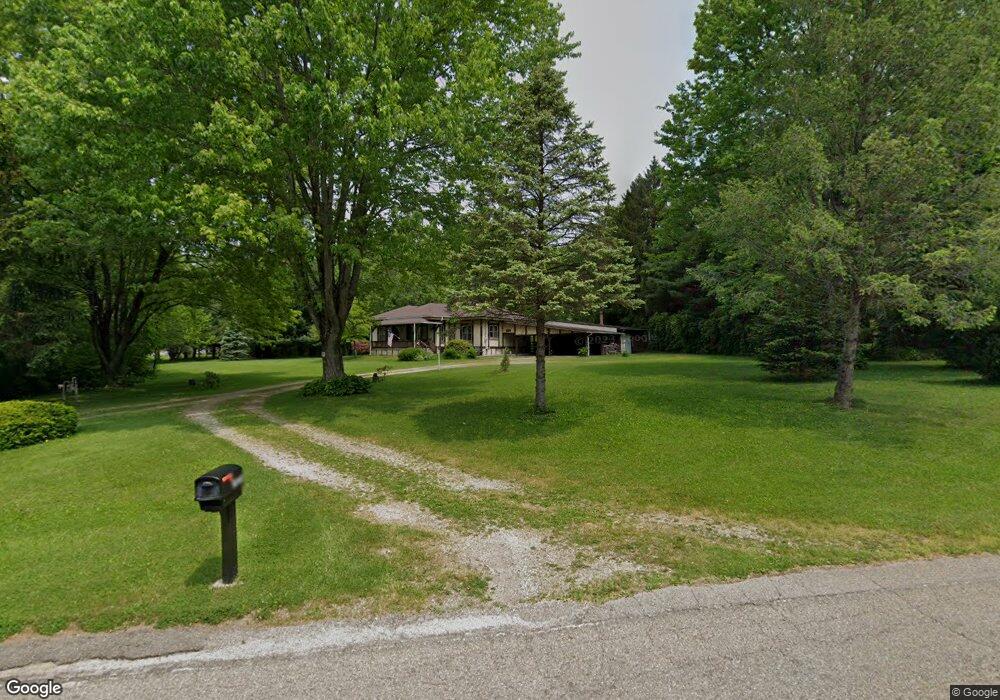
2893 Cadwallader Sonk Rd Cortland, OH 44410
Estimated Value: $147,000 - $278,000
3
Beds
2
Baths
1,426
Sq Ft
$161/Sq Ft
Est. Value
About This Home
This home is located at 2893 Cadwallader Sonk Rd, Cortland, OH 44410 and is currently estimated at $229,951, approximately $161 per square foot. 2893 Cadwallader Sonk Rd is a home located in Trumbull County with nearby schools including Lakeview Elementary School, Lakeview Middle School, and Lakeview High School.
Ownership History
Date
Name
Owned For
Owner Type
Purchase Details
Closed on
Dec 19, 2000
Sold by
Stiver Thomas T and Stiver Theresa M
Bought by
Stiver Thomas T and Stiver Theresa M
Current Estimated Value
Purchase Details
Closed on
Jan 1, 1990
Bought by
Jack R Maffitt
Create a Home Valuation Report for This Property
The Home Valuation Report is an in-depth analysis detailing your home's value as well as a comparison with similar homes in the area
Home Values in the Area
Average Home Value in this Area
Purchase History
| Date | Buyer | Sale Price | Title Company |
|---|---|---|---|
| Stiver Thomas T | -- | -- | |
| Jack R Maffitt | -- | -- |
Source: Public Records
Tax History Compared to Growth
Tax History
| Year | Tax Paid | Tax Assessment Tax Assessment Total Assessment is a certain percentage of the fair market value that is determined by local assessors to be the total taxable value of land and additions on the property. | Land | Improvement |
|---|---|---|---|---|
| 2024 | $3,159 | $73,680 | $15,440 | $58,240 |
| 2023 | $3,159 | $73,680 | $15,440 | $58,240 |
| 2022 | $2,364 | $50,550 | $14,390 | $36,160 |
| 2021 | $2,373 | $50,550 | $14,390 | $36,160 |
| 2020 | $2,387 | $50,550 | $14,390 | $36,160 |
| 2019 | $2,137 | $44,770 | $13,340 | $31,430 |
| 2018 | $2,147 | $44,770 | $13,340 | $31,430 |
| 2017 | $2,143 | $44,770 | $13,340 | $31,430 |
| 2016 | $2,083 | $42,640 | $13,340 | $29,300 |
| 2015 | $2,090 | $42,640 | $13,340 | $29,300 |
| 2014 | $1,920 | $42,640 | $13,340 | $29,300 |
| 2013 | $1,956 | $42,640 | $13,340 | $29,300 |
Source: Public Records
Map
Nearby Homes
- 2407 Northview Dr
- 0 Niles Ashtabula Rd Unit 5147189
- 0 Muir Woods Dr
- 2261 Saddlebrook Ln
- 4 Niles Cortland Rd NE
- 1 Oh-46
- 0 #3 Niles Cortland Rd- Sr 46 Unit 4274646
- 0 Niles Cortland Rd Sr 46 Unit 4273262
- 5 Oh-46
- 2342 McCleary Jacoby Rd
- 2730 Wilson Sharpsville Rd
- 3233 Niles Cortland Rd NE
- 2559 Wilson Sharpsville Rd
- 2158 Celestial Dr NE
- 2133 Silver Fox Ln NE
- 220 Wae Trail
- 1750 Portal Dr NE
- 1724 Portal Dr NE
- 19 Spring Creek Dr
- 1558 Portal Dr NE
- 2917 Cadwallader Sonk Rd
- 2886 Cadwallader Sonk Rd
- 2873 Cadwallader Sonk Rd
- 2924 Cadwallader Sonk Rd
- 2934 Cadwallader Sonk Rd
- 2852 Cadwallader Sonk Rd
- 2819 Cadwallader Sonk Rd
- 2787 Cadwallader Sonk Rd
- 2535 Henn Hyde Rd
- 2535 Henn Hyde Rd
- 0 Henn Hyde-Lot #12
- 2790 Cadwallader Sonk Rd
- 2544 Henn Hyde Rd
- 2534 Henn Hyde Rd
- 2530 Henn Hyde Rd
- 3003 Cadwallader Sonk Rd
- 2773 Cadwallader Sonk Rd
- 2510 Henn Hyde Rd
- 3017 Cadwallader Sonk Rd
- 2495 Henn Hyde Rd