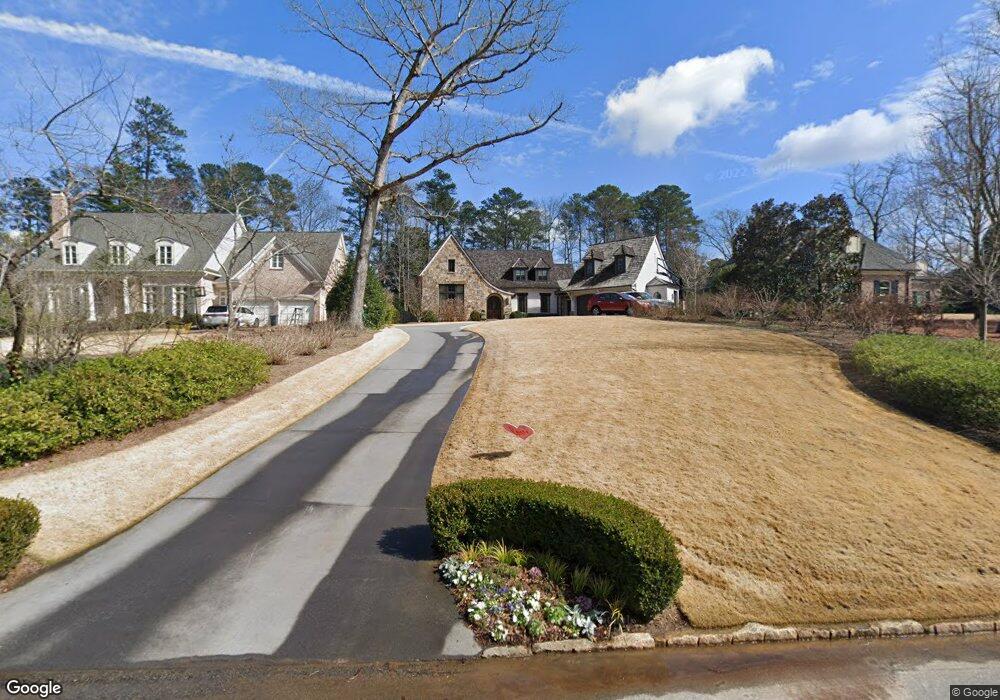
2893 Mabry Ln NE Atlanta, GA 30319
Historic Brookhaven NeighborhoodEstimated Value: $2,380,000 - $3,913,000
5
Beds
6
Baths
5,272
Sq Ft
$645/Sq Ft
Est. Value
About This Home
This home is located at 2893 Mabry Ln NE, Atlanta, GA 30319 and is currently estimated at $3,399,995, approximately $644 per square foot. 2893 Mabry Ln NE is a home located in DeKalb County with nearby schools including Dekalb Path Academy Charter School, Chamblee Charter High School, and St Martins Episcopal School.
Ownership History
Date
Name
Owned For
Owner Type
Purchase Details
Closed on
Jul 13, 2020
Sold by
Sebastian Michael H
Bought by
Regnier Ryan and Regnier Justine
Current Estimated Value
Home Financials for this Owner
Home Financials are based on the most recent Mortgage that was taken out on this home.
Original Mortgage
$1,500,000
Outstanding Balance
$1,327,608
Interest Rate
3%
Mortgage Type
New Conventional
Estimated Equity
$2,072,387
Purchase Details
Closed on
Nov 11, 2011
Sold by
Beasley Brent
Bought by
Sebastian Michael H and Sebastian Patricia W
Purchase Details
Closed on
Aug 29, 2006
Sold by
Cook Roberta K M
Bought by
Beasley Brent and Beasley Tandrea B
Home Financials for this Owner
Home Financials are based on the most recent Mortgage that was taken out on this home.
Original Mortgage
$682,500
Interest Rate
6.58%
Purchase Details
Closed on
Aug 7, 2002
Sold by
Cook Leland G
Bought by
Cook Roberta Km
Create a Home Valuation Report for This Property
The Home Valuation Report is an in-depth analysis detailing your home's value as well as a comparison with similar homes in the area
Home Values in the Area
Average Home Value in this Area
Purchase History
| Date | Buyer | Sale Price | Title Company |
|---|---|---|---|
| Regnier Ryan | $2,950,000 | -- | |
| Sebastian Michael H | $632,000 | -- | |
| Beasley Brent | $800,000 | -- | |
| Cook Roberta Km | -- | -- |
Source: Public Records
Mortgage History
| Date | Status | Borrower | Loan Amount |
|---|---|---|---|
| Open | Regnier Ryan | $1,500,000 | |
| Previous Owner | Beasley Brent | $682,500 |
Source: Public Records
Tax History Compared to Growth
Tax History
| Year | Tax Paid | Tax Assessment Tax Assessment Total Assessment is a certain percentage of the fair market value that is determined by local assessors to be the total taxable value of land and additions on the property. | Land | Improvement |
|---|---|---|---|---|
| 2024 | $31,866 | $1,183,440 | $284,026 | $899,414 |
| 2023 | $31,866 | $1,183,440 | $284,026 | $899,414 |
| 2022 | $32,198 | $1,183,440 | $286,000 | $897,440 |
| 2021 | $30,252 | $1,102,760 | $286,000 | $816,760 |
| 2020 | $19,405 | $706,680 | $260,000 | $446,680 |
| 2019 | $16,319 | $580,000 | $260,000 | $320,000 |
| 2018 | $15,425 | $580,000 | $260,000 | $320,000 |
| 2017 | $17,843 | $667,960 | $154,240 | $513,720 |
| 2016 | $13,545 | $412,800 | $152,736 | $260,064 |
| 2014 | $26,752 | $767,560 | $166,520 | $601,040 |
Source: Public Records
Map
Nearby Homes
- 2939 Mabry Ln NE
- 1058 Hunters Brook Ct NE
- 1109 Capital Club Cir NE
- 1050 E Club Ln NE
- 1146 Brookhaven Walk Way NE
- 1128 Brookhaven Walk Way NE
- 1153 Brookhaven Commons Dr NE
- 1169 Dorby Park Dr NE
- 1129 Club Trace NE
- 1085 Dunbarton Trace NE
- 2861 Dorby Close NE
- 1169 Haven Brook Way NE
- 1333 Dover Cir NE
- 4540 Club Valley Dr NE
- 1127 Wimberly Rd NE
- 1231 Ivy Brook Ln NE
- 3090 Hillview Ave NE
- 1298 Windsor Pkwy NE
- 1130 Angelo Ct NE
- 4227 Peachtree Dunwoody Rd NE
- 2885 Mabry Ln NE
- 2901 Mabry Ln NE
- 2875 Mabry Ln NE
- 0 Mabry Ln NE Unit 7523113
- 0 Mabry Ln NE Unit 7373236
- 0 Mabry Ln NE Unit 7238407
- 0 Mabry Ln NE Unit 7182570
- 0 Mabry Ln NE Unit 3279413
- 0 Mabry Ln NE Unit 3224238
- 0 Mabry Ln NE Unit 3171241
- 0 Mabry Ln NE Unit 8683731
- 0 Mabry Ln NE Unit 8002152
- 0 Mabry Ln NE Unit 8548691
- 0 Mabry Ln NE Unit 8446793
- 0 Mabry Ln NE Unit 8028135
- 0 Mabry Ln NE Unit 8706467
- 0 Mabry Ln NE Unit 8709580
- 0 Mabry Ln NE Unit 3164523
- 2915 Mabry Ln NE
- 1040 Farm Brook Ln NE