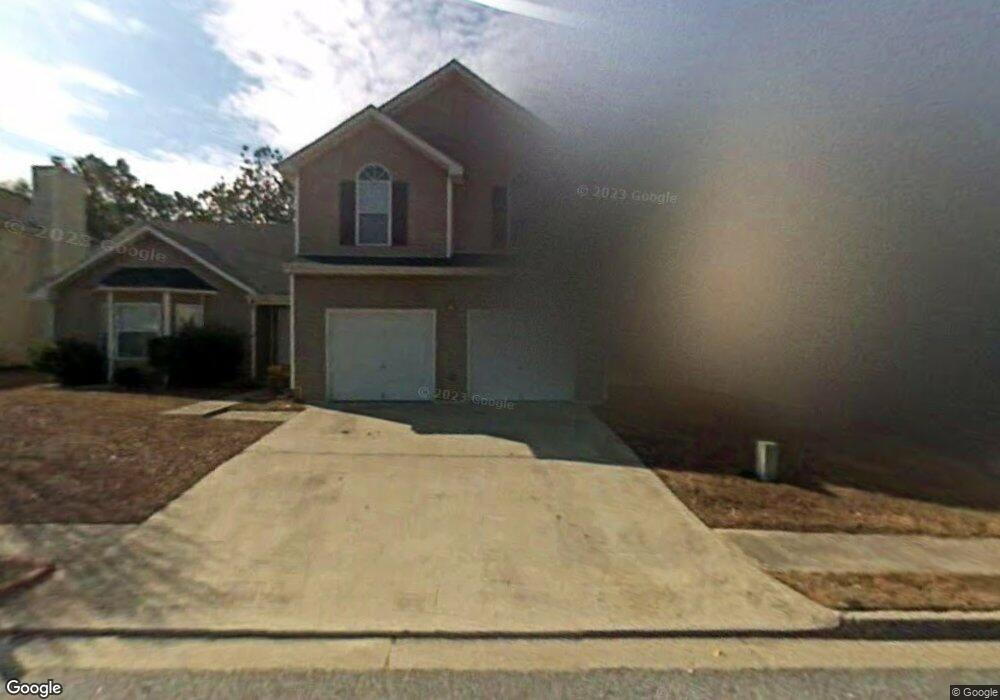
2893 Rambling Way Lithonia, GA 30058
Estimated Value: $250,037 - $277,000
3
Beds
3
Baths
2,032
Sq Ft
$129/Sq Ft
Est. Value
About This Home
This home is located at 2893 Rambling Way, Lithonia, GA 30058 and is currently estimated at $262,009, approximately $128 per square foot. 2893 Rambling Way is a home located in DeKalb County with nearby schools including Stoneview Elementary School, Lithonia Middle School, and Lithonia High School.
Ownership History
Date
Name
Owned For
Owner Type
Purchase Details
Closed on
Mar 14, 2008
Sold by
Corleon Darcel and Corleon Bill E
Bought by
Plater Patricia A
Current Estimated Value
Home Financials for this Owner
Home Financials are based on the most recent Mortgage that was taken out on this home.
Original Mortgage
$128,981
Outstanding Balance
$79,726
Interest Rate
5.68%
Mortgage Type
FHA
Estimated Equity
$182,283
Purchase Details
Closed on
Jun 26, 2007
Sold by
Hud-Housing Of Urban Dev
Bought by
Corleon Darcel
Home Financials for this Owner
Home Financials are based on the most recent Mortgage that was taken out on this home.
Original Mortgage
$96,000
Interest Rate
6.16%
Mortgage Type
New Conventional
Purchase Details
Closed on
Nov 7, 2006
Sold by
Chase Hm Fin Llc
Bought by
Secretary Of Hud
Purchase Details
Closed on
Aug 30, 2001
Sold by
Stonebridge Creek Dev Co Inc
Bought by
Phipps-Fennell Ophelia
Home Financials for this Owner
Home Financials are based on the most recent Mortgage that was taken out on this home.
Original Mortgage
$132,300
Interest Rate
6.98%
Mortgage Type
FHA
Create a Home Valuation Report for This Property
The Home Valuation Report is an in-depth analysis detailing your home's value as well as a comparison with similar homes in the area
Home Values in the Area
Average Home Value in this Area
Purchase History
| Date | Buyer | Sale Price | Title Company |
|---|---|---|---|
| Plater Patricia A | $130,000 | -- | |
| Corleon Darcel | -- | -- | |
| Secretary Of Hud | -- | -- | |
| Chase Hm Fin Llc | $149,701 | -- | |
| Phipps-Fennell Ophelia | $133,400 | -- |
Source: Public Records
Mortgage History
| Date | Status | Borrower | Loan Amount |
|---|---|---|---|
| Open | Plater Patricia A | $128,981 | |
| Previous Owner | Corleon Darcel | $96,000 | |
| Previous Owner | Phipps-Fennell Ophelia | $132,300 |
Source: Public Records
Tax History Compared to Growth
Tax History
| Year | Tax Paid | Tax Assessment Tax Assessment Total Assessment is a certain percentage of the fair market value that is determined by local assessors to be the total taxable value of land and additions on the property. | Land | Improvement |
|---|---|---|---|---|
| 2025 | $3,095 | $107,720 | $18,000 | $89,720 |
| 2024 | $3,046 | $102,560 | $18,000 | $84,560 |
| 2023 | $3,046 | $97,520 | $18,000 | $79,520 |
| 2022 | $2,469 | $82,000 | $8,000 | $74,000 |
| 2021 | $2,113 | $65,200 | $8,000 | $57,200 |
| 2020 | $1,753 | $54,400 | $8,000 | $46,400 |
| 2019 | $1,670 | $51,320 | $8,000 | $43,320 |
| 2018 | $1,380 | $48,520 | $8,000 | $40,520 |
| 2017 | $1,611 | $48,040 | $4,200 | $43,840 |
| 2016 | $1,333 | $41,120 | $4,200 | $36,920 |
| 2014 | $1,038 | $32,560 | $4,200 | $28,360 |
Source: Public Records
Map
Nearby Homes
- 3034 Stonebridge Creek Dr
- 6593 Pole Creek Dr
- 6630 Pole Creek Dr
- 6384 Stonebridge Creek Ln
- 6372 Stonebridge Creek Ln
- 6304 Kendra Ln
- 2281 Rambling Way
- 2520 Rambling Way
- 2116 Charter Ln
- 2338 Rambling Way
- 2315 Rambling Way
- 6565 Shaffers Way
- 6420 Marbut Rd
- 6460 Wellington Chase Ct
- 6457 Wellington Chase Ct
- 6410 Kennonbriar Ct
- 6470 Bedford Ln
- 6518 Wellington Chase Ct
- 2887 Rambling Way Unit 2
- 2899 Rambling Way
- 3010 Stonebridge Creek Dr
- 3016 Stonebridge Creek Dr Unit 2
- 3004 Stonebridge Creek Dr Unit 2
- 2881 Rambling Way Unit 2
- 2881 Rambling Way
- 2905 Rambling Way Unit 2
- 2894 Rambling Way
- 2998 Stonebridge Creek Dr Unit 2
- 2888 Rambling Way Unit 2
- 2900 Rambling Way Unit 2
- 2875 Rambling Way Unit 2
- 2911 Rambling Way
- 2882 Rambling Way
- 2906 Rambling Way
- 3028 Stonebridge Creek Dr
- 2992 Stonebridge Creek Dr Unit 2
- 0 Stonebridge Creek Dr Unit 7102290
- 0 Stonebridge Creek Dr Unit 7307131