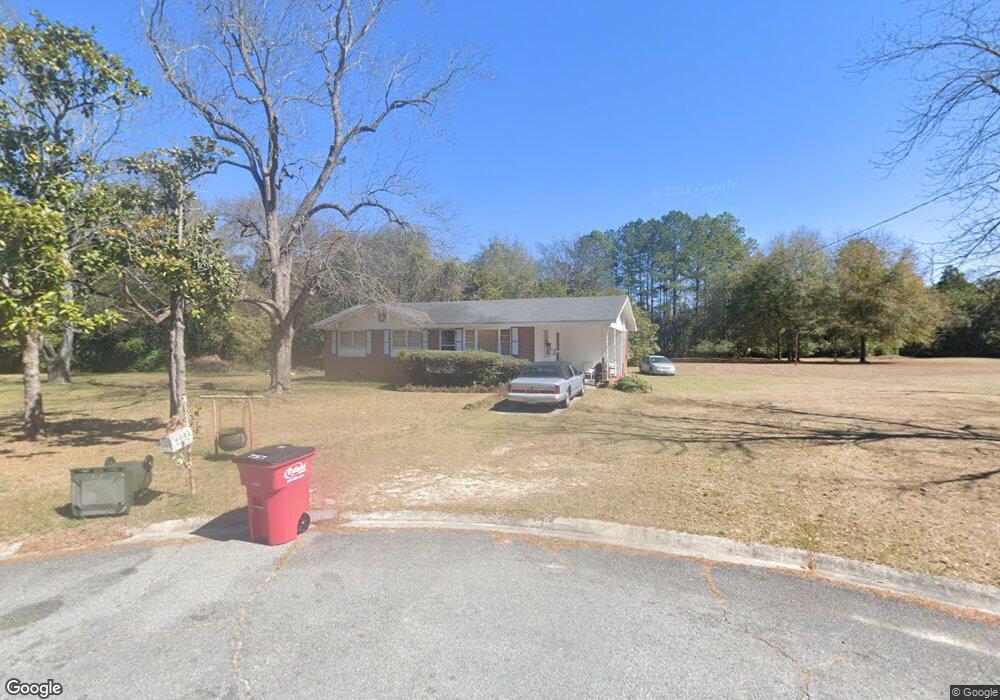
2893 Wilkes Ct Macon, GA 31217
Estimated Value: $58,000 - $87,000
2
Beds
1
Bath
1,003
Sq Ft
$73/Sq Ft
Est. Value
About This Home
This home is located at 2893 Wilkes Ct, Macon, GA 31217 and is currently estimated at $73,354, approximately $73 per square foot. 2893 Wilkes Ct is a home located in Bibb County with nearby schools including Martin Luther King Jr. Elementary School, Appling Middle School, and Northeast High School.
Ownership History
Date
Name
Owned For
Owner Type
Purchase Details
Closed on
Aug 13, 1965
Sold by
Lakeside Homes Inc
Bought by
Williams Robert W
Current Estimated Value
Create a Home Valuation Report for This Property
The Home Valuation Report is an in-depth analysis detailing your home's value as well as a comparison with similar homes in the area
Home Values in the Area
Average Home Value in this Area
Purchase History
| Date | Buyer | Sale Price | Title Company |
|---|---|---|---|
| Williams Robert W | -- | -- |
Source: Public Records
Tax History Compared to Growth
Tax History
| Year | Tax Paid | Tax Assessment Tax Assessment Total Assessment is a certain percentage of the fair market value that is determined by local assessors to be the total taxable value of land and additions on the property. | Land | Improvement |
|---|---|---|---|---|
| 2025 | $73 | $2,984 | $2,600 | $384 |
| 2024 | $76 | $2,984 | $2,600 | $384 |
| 2023 | $0 | $2,390 | $2,150 | $240 |
| 2022 | $9 | $11,526 | $1,879 | $9,647 |
| 2021 | $10 | $11,526 | $1,879 | $9,647 |
| 2020 | $121 | $16,930 | $2,088 | $14,842 |
| 2019 | $121 | $16,930 | $2,088 | $14,842 |
| 2018 | $364 | $16,930 | $2,088 | $14,842 |
| 2017 | $105 | $16,930 | $2,088 | $14,842 |
| 2016 | $87 | $16,929 | $2,088 | $14,842 |
| 2015 | $130 | $16,929 | $2,088 | $14,842 |
| 2014 | $80 | $16,929 | $2,088 | $14,842 |
Source: Public Records
Map
Nearby Homes
- 2954 Tyler Place
- 2940 Shurling Dr
- 3048 Bethune Ave
- 3145 Pasadena Dr
- 2720 Jordan Ave
- 3128 Commodore Dr
- 2675 Andy Dr
- 0 Shady Rd
- 2750 Lakeshore Dr
- 3154 Bethune Ave
- 2792 Skyline Dr
- 2035 Fairway Dr
- 2370 Recreation Rd
- 0 Shady Road Plaza
- 2229 New Clinton Rd
- 3339 Club Dr
- 2130 New Clinton Rd
- 1940 Manson Rd
- 2815 New Clinton Rd
- 860 Morningside Dr
- 2878 Wilkes Ct
- 2885 Wilkes Ct
- 2981 Tyler Place
- 2877 Wilkes Ct
- 2864 Wilkes Ct
- 2947 Norwood Ave
- 2865 Wilkes Ct
- 2916 Millerfield Rd
- 2904 Millerfield Rd
- 2924 Millerfield Rd
- 2898 Millerfield Rd
- 2934 Millerfield Rd
- 2862 Wilkes Ct
- 2963 Tyler Place
- 2851 Wilkes Ct
- 2940 Millerfield Rd
- 2733 Wells Dr
- 2862 Millerfield Rd
- 2953 Wells Dr
- 2969 Wells Dr