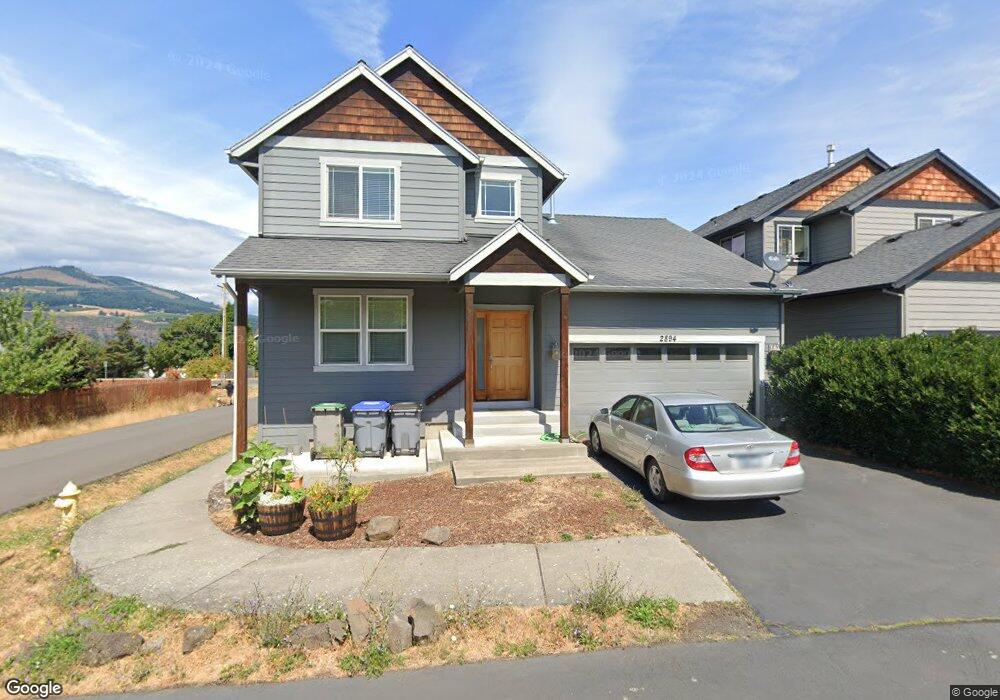
2894 Son Rise Loop Hood River, OR 97031
Estimated Value: $669,967 - $691,000
4
Beds
3
Baths
1,722
Sq Ft
$395/Sq Ft
Est. Value
About This Home
This home is located at 2894 Son Rise Loop, Hood River, OR 97031 and is currently estimated at $680,484, approximately $395 per square foot. 2894 Son Rise Loop is a home located in Hood River County with nearby schools including Westside Elementary School, Hood River Middle School, and Hood River Valley High School.
Ownership History
Date
Name
Owned For
Owner Type
Purchase Details
Closed on
Sep 16, 2015
Sold by
Nunamaker Bello Ashley and Bello Isidro
Bought by
Nunamaker Bello Ashley D and Bello Isidro
Current Estimated Value
Purchase Details
Closed on
Sep 11, 2013
Sold by
Bickler James J and Bickler Karen L
Bought by
Nunamaker Bello Ashley and Bello Isidro
Home Financials for this Owner
Home Financials are based on the most recent Mortgage that was taken out on this home.
Original Mortgage
$228,000
Outstanding Balance
$168,831
Interest Rate
4.36%
Mortgage Type
New Conventional
Estimated Equity
$511,653
Purchase Details
Closed on
Nov 15, 2005
Sold by
Son Rise Development Inc
Bought by
Bickler James J and Bickler Karen L
Purchase Details
Closed on
Apr 20, 2005
Sold by
Son Rise Development Inc
Bought by
Strzalinski Zbigniew
Create a Home Valuation Report for This Property
The Home Valuation Report is an in-depth analysis detailing your home's value as well as a comparison with similar homes in the area
Purchase History
| Date | Buyer | Sale Price | Title Company |
|---|---|---|---|
| Nunamaker Bello Ashley D | -- | Amerititle | |
| Nunamaker Bello Ashley | $285,000 | Amerititle | |
| Bickler James J | $252,701 | Amerititle | |
| Strzalinski Zbigniew | $244,491 | Amerititle |
Source: Public Records
Mortgage History
| Date | Status | Borrower | Loan Amount |
|---|---|---|---|
| Open | Nunamaker Bello Ashley | $228,000 |
Source: Public Records
Tax History
| Year | Tax Paid | Tax Assessment Tax Assessment Total Assessment is a certain percentage of the fair market value that is determined by local assessors to be the total taxable value of land and additions on the property. | Land | Improvement |
|---|---|---|---|---|
| 2025 | $4,633 | $310,570 | $180,490 | $130,080 |
| 2024 | $4,512 | $301,530 | $175,240 | $126,290 |
| 2023 | $4,512 | $292,750 | $170,140 | $122,610 |
| 2022 | $4,169 | $284,230 | $66,790 | $217,440 |
| 2021 | $4,189 | $275,960 | $64,850 | $211,110 |
| 2020 | $4,050 | $267,930 | $62,960 | $204,970 |
| 2019 | $3,778 | $260,130 | $61,130 | $199,000 |
| 2018 | $3,817 | $252,560 | $59,350 | $193,210 |
| 2017 | $3,747 | $245,210 | $57,630 | $187,580 |
| 2016 | $3,652 | $238,070 | $55,950 | $182,120 |
| 2015 | $3,588 | $231,140 | $54,320 | $176,820 |
| 2014 | $3,533 | $224,410 | $52,740 | $171,670 |
| 2013 | -- | $217,880 | $51,200 | $166,680 |
Source: Public Records
Map
Nearby Homes
- 1110 Red Tail Loop
- 1250 29th St
- 1229 29th St
- 921 Goose Way
- 1102 Rock Creek Rd
- 1106 Rock Creek Rd
- 1112 Blackberry Dr
- 1110 Rock Creek Rd
- 1116 Rock Creek Rd
- 419421 Maxs Place
- 3653 Park Place
- 2419 Prospect Ave
- 2455 Belmont Dr
- 2860 May St
- 909 Nina Ln
- 814 Henderson Rd
- 2019 Montello Ave
- 3940 Carr Dr Unit LOT 3
- 3940 Carr Dr Unit LOT 2
- 2727 Cascade Ave
- 2890 Son Rise Loop
- 2893 May St
- 2891 May St
- 2886 Son Rise Loop
- 907 Falcon Ct
- 2873 Son Rise Loop
- 2889 May St
- 2887 May St
- 919 Falcon Ct
- 2882 Son Rise Loop
- 2878 Son Rise Loop
- 2878 Son-Rise Loop
- 2885 May St
- 2874 Son-Rise Loop
- 1015 Redtail Loop
- 1015 Redtail Loop Unit Lot 9
- 1015 Red Tail Loop
- 2892 Son Rise Loop
- 2870 Son Rise Loop
- 2892 Son-Rise Loop
Your Personal Tour Guide
Ask me questions while you tour the home.