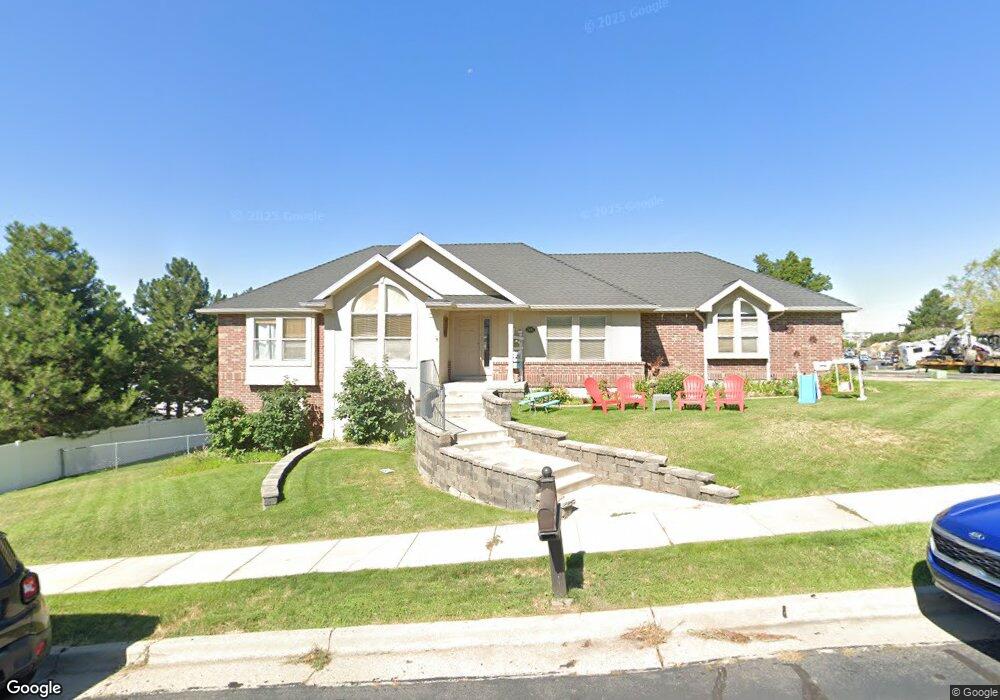
2895 N 2225 E Layton, UT 84040
Estimated Value: $520,000 - $699,000
4
Beds
3
Baths
3,200
Sq Ft
$179/Sq Ft
Est. Value
About This Home
This home is located at 2895 N 2225 E, Layton, UT 84040 and is currently estimated at $572,742, approximately $178 per square foot. 2895 N 2225 E is a home located in Davis County with nearby schools including Mountain View Elementary School, North Layton Junior High School, and Northridge High School.
Ownership History
Date
Name
Owned For
Owner Type
Purchase Details
Closed on
Feb 25, 2009
Sold by
E B Enterprises Inc
Bought by
Thiede Ii Inc
Current Estimated Value
Purchase Details
Closed on
Jan 26, 2007
Sold by
Swanson Sandra L
Bought by
Eb Enterprises Inc
Purchase Details
Closed on
Oct 16, 2003
Sold by
Eldracher Larry and Eldracher Sherrie
Bought by
Swanson Sandra L
Home Financials for this Owner
Home Financials are based on the most recent Mortgage that was taken out on this home.
Original Mortgage
$201,750
Interest Rate
6.4%
Mortgage Type
Purchase Money Mortgage
Purchase Details
Closed on
Dec 23, 2002
Sold by
Smetana Nelson Dale and Nelson Dale S
Bought by
Eldracher Larry and Eldracher Sherrie
Create a Home Valuation Report for This Property
The Home Valuation Report is an in-depth analysis detailing your home's value as well as a comparison with similar homes in the area
Home Values in the Area
Average Home Value in this Area
Purchase History
| Date | Buyer | Sale Price | Title Company |
|---|---|---|---|
| Thiede Ii Inc | -- | None Available | |
| Eb Enterprises Inc | -- | First American Title | |
| Swanson Sandra L | -- | First American Title Co | |
| Eldracher Larry | -- | First American Title Co |
Source: Public Records
Mortgage History
| Date | Status | Borrower | Loan Amount |
|---|---|---|---|
| Previous Owner | Swanson Sandra L | $201,750 |
Source: Public Records
Tax History
| Year | Tax Paid | Tax Assessment Tax Assessment Total Assessment is a certain percentage of the fair market value that is determined by local assessors to be the total taxable value of land and additions on the property. | Land | Improvement |
|---|---|---|---|---|
| 2025 | $2,788 | $271,700 | $103,706 | $167,994 |
| 2024 | $2,642 | $260,699 | $128,629 | $132,070 |
| 2023 | $2,690 | $260,150 | $98,423 | $161,726 |
| 2022 | $2,918 | $511,000 | $173,631 | $337,369 |
| 2021 | $2,630 | $377,000 | $144,556 | $232,444 |
| 2020 | $2,395 | $329,000 | $113,993 | $215,007 |
| 2019 | $2,342 | $317,000 | $102,484 | $214,516 |
| 2018 | $2,155 | $293,000 | $61,283 | $231,717 |
| 2016 | $1,996 | $142,010 | $31,290 | $110,720 |
| 2015 | $2,015 | $136,730 | $31,290 | $105,440 |
| 2014 | $1,984 | $138,272 | $31,290 | $106,982 |
| 2013 | -- | $123,669 | $26,884 | $96,785 |
Source: Public Records
Map
Nearby Homes
- 2353 Canyon View Dr
- 1935 Deere Valley Dr
- 1911 Deere Valley Dr
- 3232 N Redtail Way
- 2597 N 2300 E
- 1821 E Whitetail Way
- 1827 E Whitetail Dr
- 1785 E 2825 N
- 1731 E 2825 N
- 2826 N 1600 E
- 2340 N 2050 E
- 2273 N 1975 E
- 3142 E Thorley Dr
- 3138 E Thorley Dr
- 1447 E 2700 N
- 2563 E 2250 N
- 2569 N 2900 E
- 2189 N 1950 E
- 3176 N 1450 E
- 1321 E 3125 N
- 2192 E 2900 N
- 2190 E 2900 N
- 2896 N 2225 E
- 2211 Deere View Dr
- 2211 Deere View Dr
- 2220 E 2900 N
- 2220 E 2900 N Unit 43
- 2182 E 2900 N
- 2187 Deere View Dr
- 2195 E 2900 N
- 2244 E 2900 N
- 2241 Deere View Dr
- 2929 N 2225 E
- 2174 E 2900 N
- 2254 E 2900 N
- 2920 N 2225 E
- 2920 N 2150 E
- 2167 Deere View Dr
- 2257 Deere View Dr
- 2166 E 2900 N
Your Personal Tour Guide
Ask me questions while you tour the home.