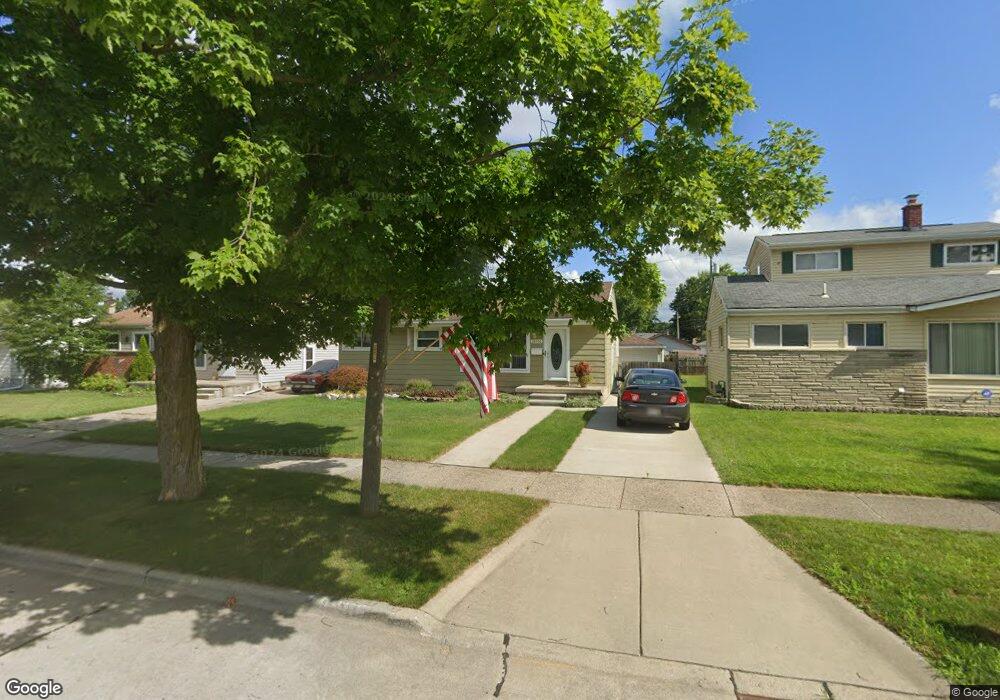
28958 Florence St Garden City, MI 48135
Estimated Value: $154,000 - $210,000
--
Bed
--
Bath
882
Sq Ft
$202/Sq Ft
Est. Value
About This Home
This home is located at 28958 Florence St, Garden City, MI 48135 and is currently estimated at $178,536, approximately $202 per square foot. 28958 Florence St is a home located in Wayne County with nearby schools including Memorial Elementary 1-2 Campus, Douglas Elementary 3-4 Campus, and Farmington 5-6 Campus.
Ownership History
Date
Name
Owned For
Owner Type
Purchase Details
Closed on
Nov 1, 2007
Sold by
Jackson Alphonso R
Bought by
Noel Jeffrey S
Current Estimated Value
Purchase Details
Closed on
Jun 27, 2007
Sold by
Mortgage Electronic Registration Systems
Bought by
Hud
Purchase Details
Closed on
Sep 20, 2006
Sold by
Waters Stephanie and Waters James M
Bought by
Mortgage Electronic Registration Systems and Flagstar Bank Fsb
Purchase Details
Closed on
Jan 28, 2005
Sold by
Waters James M and Waters Stephanie
Bought by
Waters James M
Home Financials for this Owner
Home Financials are based on the most recent Mortgage that was taken out on this home.
Original Mortgage
$136,760
Interest Rate
5.78%
Mortgage Type
FHA
Purchase Details
Closed on
May 11, 2004
Sold by
Boal Marilyn M and Smith Walter O
Bought by
Waters James M
Create a Home Valuation Report for This Property
The Home Valuation Report is an in-depth analysis detailing your home's value as well as a comparison with similar homes in the area
Home Values in the Area
Average Home Value in this Area
Purchase History
| Date | Buyer | Sale Price | Title Company |
|---|---|---|---|
| Noel Jeffrey S | $82,000 | None Available | |
| Hud | -- | None Available | |
| Mortgage Electronic Registration Systems | $140,909 | None Available | |
| Waters James M | -- | Multiple | |
| Waters James M | $130,450 | Devon Title Agency |
Source: Public Records
Mortgage History
| Date | Status | Borrower | Loan Amount |
|---|---|---|---|
| Previous Owner | Waters James M | $136,760 |
Source: Public Records
Tax History Compared to Growth
Tax History
| Year | Tax Paid | Tax Assessment Tax Assessment Total Assessment is a certain percentage of the fair market value that is determined by local assessors to be the total taxable value of land and additions on the property. | Land | Improvement |
|---|---|---|---|---|
| 2025 | $1,959 | $83,700 | $0 | $0 |
| 2024 | $1,959 | $75,800 | $0 | $0 |
| 2023 | $1,844 | $69,000 | $0 | $0 |
| 2022 | $2,070 | $57,100 | $0 | $0 |
| 2021 | $2,026 | $53,600 | $0 | $0 |
| 2020 | $2,038 | $49,500 | $0 | $0 |
| 2019 | $1,676 | $42,100 | $0 | $0 |
| 2018 | $1,495 | $35,400 | $0 | $0 |
| 2017 | $486 | $35,300 | $0 | $0 |
| 2016 | $1,701 | $33,100 | $0 | $0 |
| 2015 | $2,942 | $32,500 | $0 | $0 |
| 2013 | $2,850 | $29,500 | $0 | $0 |
| 2012 | $1,707 | $30,700 | $10,300 | $20,400 |
Source: Public Records
Map
Nearby Homes
- 29031 Rosslyn Ave
- 28783 Leona St
- 28432 Alvin St
- 28524 Barton St
- 29487 Florence St
- 28315 Sheridan St
- 28999 Beechnut St
- 1147 Harrison St
- 641 Gilman St
- 29578 Brown Ct
- 120 Lathers St
- 29699 Brown Ct
- 251 Helen St
- 1125 Brandt St
- 29404 Meadow Ln Unit 1
- 28930 Birchwood St
- 0000 Brandt St
- 1782 Gilman St
- 29643 Steinhauer St
- 27566 Sheridan St
- 29006 Florence St
- 28952 Florence St
- 28946 Florence St
- 29014 Florence St
- 29100 Florence St
- 28981 Rosslyn Ave
- 28971 Rosslyn Ave
- 28940 Florence St
- 28991 Rosslyn Ave
- 28961 Rosslyn Ave
- 29110 Florence St
- 29001 Rosslyn Ave Unit Bldg-Unit
- 29001 Rosslyn Ave
- 29011 Rosslyn Ave
- 28955 Florence St
- 28949 Florence St
- 28951 Rosslyn Ave
- 29003 Florence St Unit Bldg-Unit
- 29003 Florence St
- 28930 Florence St