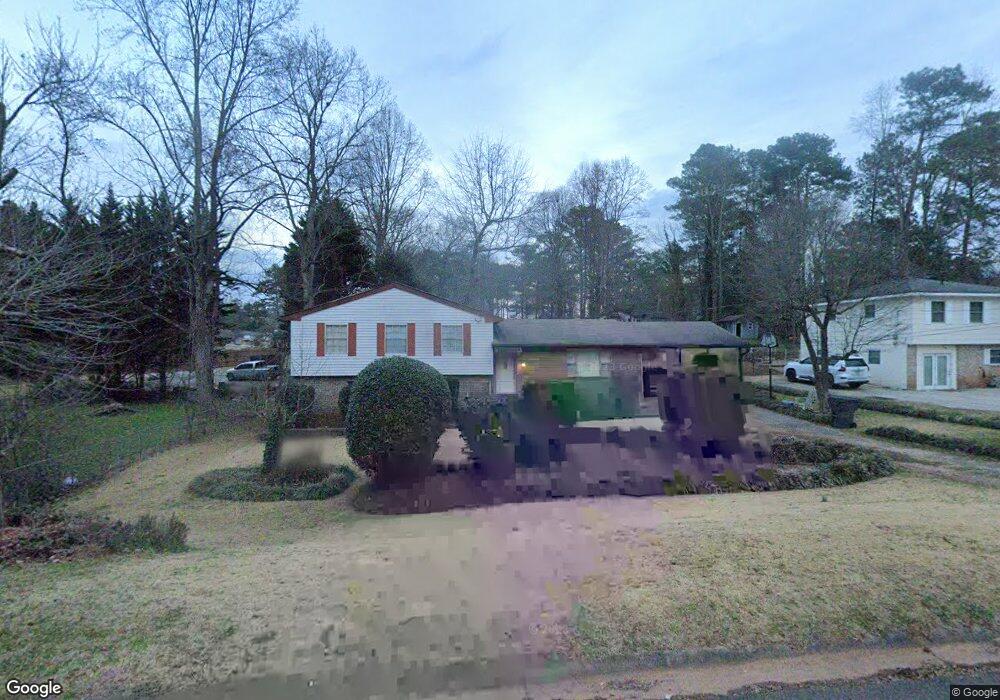
2896 Oxford Way Duluth, GA 30096
Estimated Value: $345,000 - $414,000
3
Beds
2
Baths
2,267
Sq Ft
$169/Sq Ft
Est. Value
About This Home
This home is located at 2896 Oxford Way, Duluth, GA 30096 and is currently estimated at $382,500, approximately $168 per square foot. 2896 Oxford Way is a home located in Gwinnett County with nearby schools including B.B. Harris Elementary School, Duluth Middle School, and Duluth High School.
Ownership History
Date
Name
Owned For
Owner Type
Purchase Details
Closed on
Oct 6, 2008
Sold by
Schmude Dennis
Bought by
Hong Scott Y
Current Estimated Value
Home Financials for this Owner
Home Financials are based on the most recent Mortgage that was taken out on this home.
Original Mortgage
$106,800
Outstanding Balance
$70,199
Interest Rate
6.36%
Mortgage Type
New Conventional
Estimated Equity
$312,301
Purchase Details
Closed on
May 31, 2007
Sold by
Schmude Gwen
Bought by
Schmude Dennis
Home Financials for this Owner
Home Financials are based on the most recent Mortgage that was taken out on this home.
Original Mortgage
$63,000
Interest Rate
5.82%
Mortgage Type
New Conventional
Purchase Details
Closed on
Sep 5, 1997
Sold by
Diroberto Vickie E
Bought by
Schmude Dennis and Schmude Gwen
Home Financials for this Owner
Home Financials are based on the most recent Mortgage that was taken out on this home.
Original Mortgage
$71,900
Interest Rate
7%
Mortgage Type
New Conventional
Create a Home Valuation Report for This Property
The Home Valuation Report is an in-depth analysis detailing your home's value as well as a comparison with similar homes in the area
Home Values in the Area
Average Home Value in this Area
Purchase History
| Date | Buyer | Sale Price | Title Company |
|---|---|---|---|
| Hong Scott Y | $133,500 | -- | |
| Schmude Dennis | -- | -- | |
| Schmude Dennis | $89,900 | -- |
Source: Public Records
Mortgage History
| Date | Status | Borrower | Loan Amount |
|---|---|---|---|
| Open | Hong Scott Y | $106,800 | |
| Previous Owner | Schmude Dennis | $63,000 | |
| Previous Owner | Schmude Dennis | $71,900 |
Source: Public Records
Tax History Compared to Growth
Tax History
| Year | Tax Paid | Tax Assessment Tax Assessment Total Assessment is a certain percentage of the fair market value that is determined by local assessors to be the total taxable value of land and additions on the property. | Land | Improvement |
|---|---|---|---|---|
| 2025 | $5,658 | $150,520 | $27,880 | $122,640 |
| 2024 | $5,771 | $152,160 | $31,200 | $120,960 |
| 2023 | $5,771 | $140,840 | $22,000 | $118,840 |
| 2022 | $4,568 | $119,120 | $22,000 | $97,120 |
| 2021 | $3,575 | $89,880 | $18,000 | $71,880 |
| 2020 | $3,378 | $83,920 | $16,000 | $67,920 |
| 2019 | $3,254 | $83,920 | $16,000 | $67,920 |
| 2018 | $2,735 | $69,080 | $12,800 | $56,280 |
| 2016 | $2,257 | $54,920 | $11,600 | $43,320 |
| 2015 | $2,133 | $50,800 | $11,600 | $39,200 |
| 2014 | $2,024 | $47,440 | $8,000 | $39,440 |
Source: Public Records
Map
Nearby Homes
- 2829 Cardinal Trace
- 3355 Cresswell Link Way
- The Freemont Plan at Evanshire - Townhomes
- The Garrison Plan at Evanshire - Townhomes
- The Stockton Plan at Evanshire - Townhomes
- 2240 Siskin Square Rd
- 2240 Siskin Square Rd Unit 88
- 2812 Evanshire Ave Unit 110
- 2772 Evanshire Ave Unit 106
- 2802 Evanshire Ave Unit 109
- 2862 Evanshire Ave Unit 115
- 2280 Siskin Square Rd Unit 92
- 2842 Evanshire Ave Unit 113
- 2822 Evanshire Ave Unit 111
- 2832 Evanshire Ave Unit 112
- 2270 Siskin Square Rd Unit 91
- 2852 Evanshire Ave Unit 114
- 2816 Cardinal Lake Cir NW
- 2830 Meadow Lark Trail
- 3050 Orchard Ridge Cir
- 2886 Oxford Way
- 3132 Claiborne Dr Unit 1
- 3142 Claiborne Dr Unit 1
- 2876 Oxford Way
- 3122 Claiborne Dr
- 2895 NE Claiborne Dr
- 2885 London Ln Unit 2
- 3162 Claiborne Dr Unit 1
- 2907 Oxford Way
- 2897 Oxford Way
- 3112 Claiborne Dr
- 2866 Oxford Way
- 2875 London Ln
- 2887 Oxford Way
- 3172 Claiborne Dr
- 2877 Oxford Way Unit 3
- 3163 Claiborne Dr NW
- 3143 Claiborne Dr
- 3182 Claiborne Dr Unit 1
- 3153 Claiborne Dr