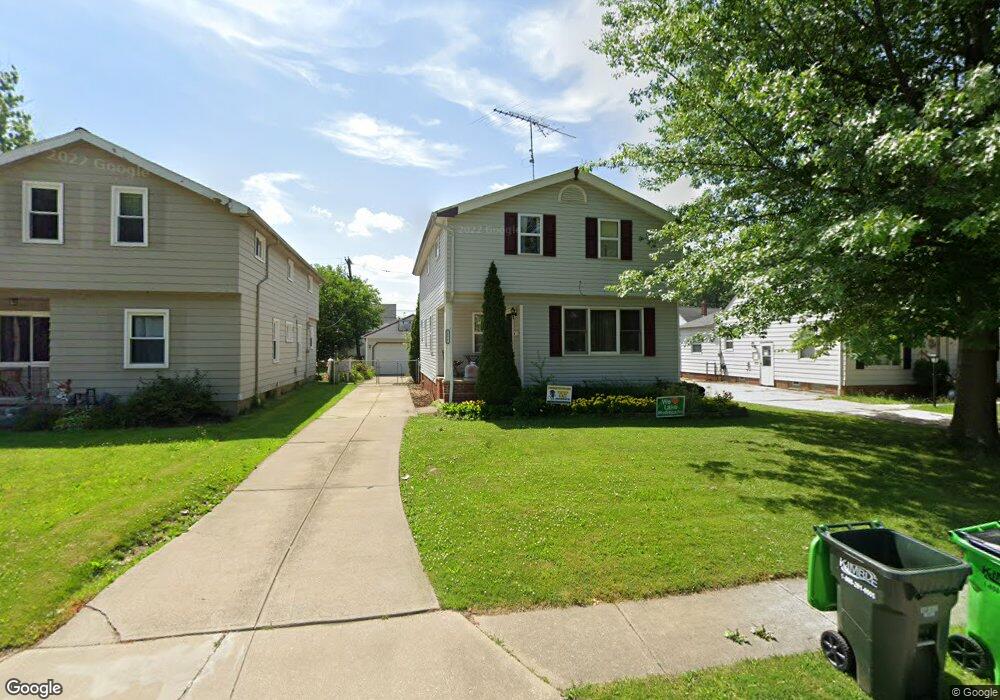
28962 Weber Ave Wickliffe, OH 44092
Estimated Value: $191,000 - $224,000
3
Beds
2
Baths
888
Sq Ft
$238/Sq Ft
Est. Value
About This Home
This home is located at 28962 Weber Ave, Wickliffe, OH 44092 and is currently estimated at $211,016, approximately $237 per square foot. 28962 Weber Ave is a home located in Lake County with nearby schools including Wickliffe Elementary School, Wickliffe Middle School, and Wickliffe High School.
Ownership History
Date
Name
Owned For
Owner Type
Purchase Details
Closed on
Aug 9, 2005
Sold by
Fees David M and Fees Cathy
Bought by
Doty Christopher W and Cannady Shannon C
Current Estimated Value
Home Financials for this Owner
Home Financials are based on the most recent Mortgage that was taken out on this home.
Original Mortgage
$120,600
Outstanding Balance
$62,153
Interest Rate
5.66%
Mortgage Type
Fannie Mae Freddie Mac
Estimated Equity
$148,863
Purchase Details
Closed on
Sep 1, 1999
Sold by
Seget Marko A
Bought by
Fees David M
Home Financials for this Owner
Home Financials are based on the most recent Mortgage that was taken out on this home.
Original Mortgage
$125,436
Interest Rate
7.59%
Mortgage Type
FHA
Purchase Details
Closed on
Apr 19, 1999
Sold by
Mitrovich Sam and Mitrovich Donna
Bought by
Seget Marko A
Purchase Details
Closed on
Jan 1, 1990
Bought by
Mitrovich Sam
Create a Home Valuation Report for This Property
The Home Valuation Report is an in-depth analysis detailing your home's value as well as a comparison with similar homes in the area
Home Values in the Area
Average Home Value in this Area
Purchase History
| Date | Buyer | Sale Price | Title Company |
|---|---|---|---|
| Doty Christopher W | $134,000 | First American Title | |
| Fees David M | $125,500 | Transcounty Title Agency Inc | |
| Seget Marko A | $75,000 | -- | |
| Mitrovich Sam | -- | -- |
Source: Public Records
Mortgage History
| Date | Status | Borrower | Loan Amount |
|---|---|---|---|
| Open | Doty Christopher W | $120,600 | |
| Closed | Fees David M | $125,436 |
Source: Public Records
Tax History
| Year | Tax Paid | Tax Assessment Tax Assessment Total Assessment is a certain percentage of the fair market value that is determined by local assessors to be the total taxable value of land and additions on the property. | Land | Improvement |
|---|---|---|---|---|
| 2025 | -- | $78,500 | $12,140 | $66,360 |
| 2024 | -- | $78,500 | $12,140 | $66,360 |
| 2023 | $6,545 | $53,220 | $10,340 | $42,880 |
| 2022 | $3,818 | $53,220 | $10,340 | $42,880 |
| 2021 | $3,834 | $53,220 | $10,340 | $42,880 |
| 2020 | $3,698 | $43,620 | $8,480 | $35,140 |
| 2019 | $3,696 | $43,620 | $8,480 | $35,140 |
| 2018 | $3,011 | $40,250 | $14,460 | $25,790 |
| 2017 | $2,834 | $40,250 | $14,460 | $25,790 |
| 2016 | $2,820 | $40,250 | $14,460 | $25,790 |
| 2015 | $2,770 | $40,250 | $14,460 | $25,790 |
| 2014 | $2,440 | $40,250 | $14,460 | $25,790 |
| 2013 | $2,439 | $40,250 | $14,460 | $25,790 |
Source: Public Records
Map
Nearby Homes
- 670 Hemlock Dr
- 597 Hemlock Dr
- 591 Hemlock Dr
- 730 Hemlock Dr
- 27190 Zeman Ave
- 27430 Forestview Ave
- 815 E 272nd St
- 27125 Mallard Ave
- 26931 Shoreview Ave
- 29310 Grand Blvd
- 26831 Shoreview Ave
- 625 Lloyd Rd
- 440 E 271st St
- 610 E 266th St
- 866 Elmwood Ave
- 427 E 275th St
- 29566 Shaker Dr
- 26430 Drakefield Ave
- 1354 Craneing Rd
- 27175 Cameron Ave
- 28966 Weber Ave
- 28956 Weber Ave
- 29002 Weber Ave
- 29004 Weber Ave
- 28963 Homewood Dr
- 28959 Homewood Dr
- 28952 Weber Ave
- 28955 Homewood Dr
- 29005 Homewood Dr
- 28959 Weber Ave
- 29010 Weber Ave
- 29009 Homewood Dr
- 28953 Homewood Dr
- 29001 Weber Ave
- 29015 Homewood Dr
- 29003 Weber Ave
- 29014 Weber Ave
- 667 Walnut Dr
- 657 Walnut Dr
- 29007 Weber Ave
Your Personal Tour Guide
Ask me questions while you tour the home.