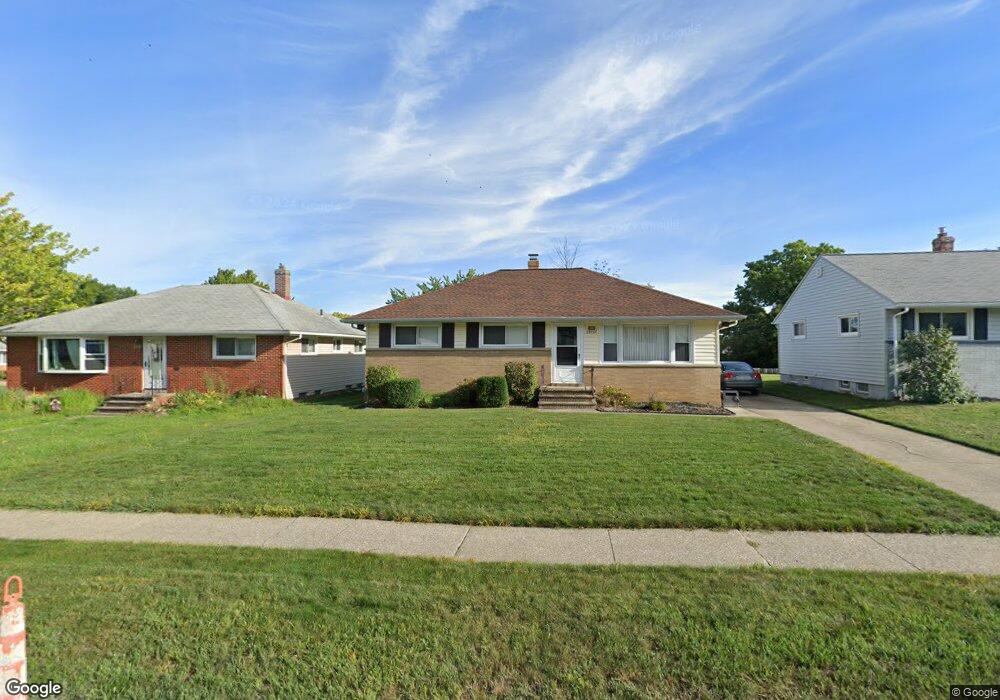
28967 Sherbrook Dr Wickliffe, OH 44092
Estimated Value: $169,969 - $235,000
3
Beds
1
Bath
1,140
Sq Ft
$180/Sq Ft
Est. Value
About This Home
This home is located at 28967 Sherbrook Dr, Wickliffe, OH 44092 and is currently estimated at $204,742, approximately $179 per square foot. 28967 Sherbrook Dr is a home located in Lake County with nearby schools including Wickliffe Elementary School, Wickliffe Middle School, and Wickliffe High School.
Ownership History
Date
Name
Owned For
Owner Type
Purchase Details
Closed on
Jun 24, 2017
Sold by
Defrank Judith A and Defrank Joseph
Bought by
Godec Ronald J
Current Estimated Value
Home Financials for this Owner
Home Financials are based on the most recent Mortgage that was taken out on this home.
Original Mortgage
$70,000
Outstanding Balance
$58,049
Interest Rate
3.91%
Mortgage Type
New Conventional
Estimated Equity
$146,693
Purchase Details
Closed on
Nov 27, 2015
Sold by
Tordolino Janet M
Bought by
Godec Ronald J
Purchase Details
Closed on
May 8, 1992
Bought by
Godec Eleanor M
Create a Home Valuation Report for This Property
The Home Valuation Report is an in-depth analysis detailing your home's value as well as a comparison with similar homes in the area
Home Values in the Area
Average Home Value in this Area
Purchase History
| Date | Buyer | Sale Price | Title Company |
|---|---|---|---|
| Godec Ronald J | $217,000 | None Available | |
| Godec Ronald J | $52,500 | None Available | |
| Godec Eleanor M | -- | -- |
Source: Public Records
Mortgage History
| Date | Status | Borrower | Loan Amount |
|---|---|---|---|
| Open | Godec Ronald J | $70,000 |
Source: Public Records
Tax History Compared to Growth
Tax History
| Year | Tax Paid | Tax Assessment Tax Assessment Total Assessment is a certain percentage of the fair market value that is determined by local assessors to be the total taxable value of land and additions on the property. | Land | Improvement |
|---|---|---|---|---|
| 2024 | -- | $54,590 | $14,270 | $40,320 |
| 2023 | $6,030 | $49,030 | $12,400 | $36,630 |
| 2022 | $1,650 | $31,500 | $17,630 | $13,870 |
| 2021 | $1,662 | $31,500 | $17,630 | $13,870 |
| 2020 | $2,051 | $31,500 | $17,630 | $13,870 |
| 2019 | $1,951 | $31,500 | $17,630 | $13,870 |
| 2018 | $1,651 | $31,500 | $17,630 | $13,870 |
| 2017 | $1,613 | $31,500 | $17,630 | $13,870 |
| 2016 | $1,972 | $36,750 | $17,630 | $19,120 |
| 2015 | $2,592 | $36,750 | $17,630 | $19,120 |
| 2014 | $2,592 | $41,590 | $17,630 | $23,960 |
| 2013 | $2,591 | $41,590 | $17,630 | $23,960 |
Source: Public Records
Map
Nearby Homes
- 2715 Cabin Dr
- 2253 E 290th St
- 28862 Eddy Rd
- 28828 Eddy Rd
- 0 Green Ridge Dr
- 2825 Orchard Dr
- 2603 Rockefeller Rd
- 2811 Bishop Rd
- V/L 39 Chardon Rd
- 25 Arlington Cir
- 1811 Lincoln Rd
- 29 Arlington Cir
- 1821 Lincoln Rd
- 28900 Euclid Ave
- Birch Plan at Old School Village
- Elder Plan at Old School Village
- Cedar Plan at Old School Village
- Aspen Plan at Old School Village
- Tupelo Plan at Old School Village
- 1836 E 294th St
- 28973 Sherbrook Dr
- 28961 Sherbrook Dr
- 2429 Stanford Dr
- 28979 Sherbrook Dr
- 2411 Stanford Dr
- 28985 Sherbrook Dr
- 2432 E 290th St
- 28964 Sherbrook Dr
- 2428 E 290th St
- 28970 Sherbrook Dr
- 28958 Sherbrook Dr
- 2440 Stanford Dr
- 28976 Sherbrook Dr
- 2420 E 290th St
- 2432 Stanford Dr
- 28991 Sherbrook Dr
- 28952 Sherbrook Dr
- 2407 Stanford Dr
- 2410 E 290th St
- 2410 Stanford Dr