Estimated Value: $442,740 - $486,000
--
Bed
--
Bath
1,344
Sq Ft
$343/Sq Ft
Est. Value
About This Home
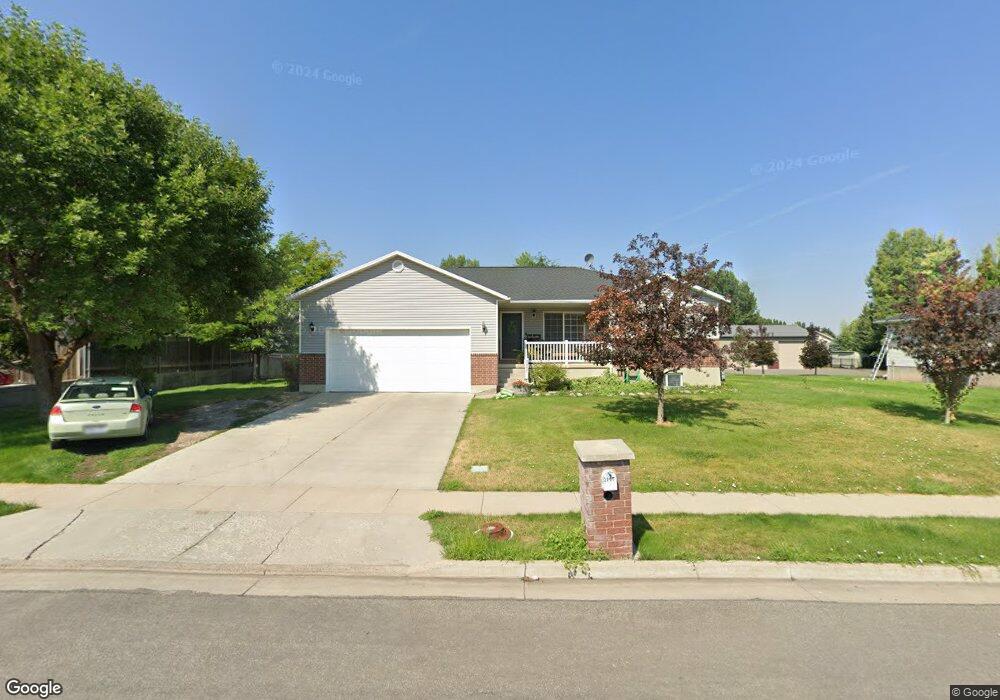
This home is located at 2897 S 450 W, Logan, UT 84321 and is currently estimated at $460,935, approximately $342 per square foot. 2897 S 450 W is a home with nearby schools including Nibley School, Spring Creek Middle School, and South Cache Middle School.
Ownership History
Date
Name
Owned For
Owner Type
Purchase Details
Closed on
Feb 22, 2006
Sold by
Naylor Jason
Bought by
Naylor Tammy
Current Estimated Value
Purchase Details
Closed on
Jul 9, 2001
Sold by
A & A Wiser Construction Inc
Bought by
Naylor Jason and Naylor Tammy
Home Financials for this Owner
Home Financials are based on the most recent Mortgage that was taken out on this home.
Original Mortgage
$143,000
Outstanding Balance
$53,831
Interest Rate
7.14%
Mortgage Type
Seller Take Back
Estimated Equity
$407,104
Purchase Details
Closed on
Jun 15, 2001
Sold by
A & A Wiser Construction Inc
Bought by
Naylor Jason and Naylor Tammy
Home Financials for this Owner
Home Financials are based on the most recent Mortgage that was taken out on this home.
Original Mortgage
$143,000
Outstanding Balance
$53,831
Interest Rate
7.14%
Mortgage Type
Seller Take Back
Estimated Equity
$407,104
Create a Home Valuation Report for This Property
The Home Valuation Report is an in-depth analysis detailing your home's value as well as a comparison with similar homes in the area
Home Values in the Area
Average Home Value in this Area
Purchase History
| Date | Buyer | Sale Price | Title Company |
|---|---|---|---|
| Naylor Tammy | -- | None Available | |
| Naylor Jason | -- | Advanced Title Co | |
| Naylor Jason | -- | Advanced Title Co |
Source: Public Records
Mortgage History
| Date | Status | Borrower | Loan Amount |
|---|---|---|---|
| Open | Naylor Jason | $143,000 |
Source: Public Records
Tax History Compared to Growth
Tax History
| Year | Tax Paid | Tax Assessment Tax Assessment Total Assessment is a certain percentage of the fair market value that is determined by local assessors to be the total taxable value of land and additions on the property. | Land | Improvement |
|---|---|---|---|---|
| 2025 | $1,701 | $225,475 | $0 | $0 |
| 2024 | $1,802 | $224,315 | $0 | $0 |
| 2023 | $1,885 | $219,620 | $0 | $0 |
| 2022 | $1,962 | $219,620 | $0 | $0 |
| 2021 | $1,918 | $333,445 | $70,000 | $263,445 |
| 2020 | $1,743 | $288,592 | $70,000 | $218,592 |
| 2019 | $1,829 | $288,592 | $70,000 | $218,592 |
| 2018 | $1,527 | $235,080 | $45,000 | $190,080 |
| 2017 | $1,469 | $119,790 | $0 | $0 |
| 2016 | $1,485 | $119,790 | $0 | $0 |
| 2015 | $1,330 | $107,985 | $0 | $0 |
| 2014 | $1,300 | $107,985 | $0 | $0 |
| 2013 | -- | $112,935 | $0 | $0 |
Source: Public Records
Map
Nearby Homes
- 2938 S 600 W
- 406 W 3025 S
- 374 Ropelato Dr
- 400 W 3085 S
- 412 W 3085 S
- 269 W 2950 S
- 2615 S 600 W
- 251 W 2950 S
- 3085 225 West G204
- 3085 225 West G301
- 3085 225 West G302
- 3085 225 West G203
- 3085 225 West G202
- 3085 225 West G304
- 3085 S 225 W Unit G203
- 225 W 2975 S
- Lyndhurst Plan at Ridgeline Park - Nibley (Active Adult)
- Blackberry Plan at Ridgeline Park - Nibley
- Auburn Plan at Ridgeline Park - Nibley
- Auburn Plan at Ridgeline Park - Nibley (Active Adult)