Estimated Value: $491,000 - $556,000
4
Beds
3
Baths
2,512
Sq Ft
$210/Sq Ft
Est. Value
About This Home
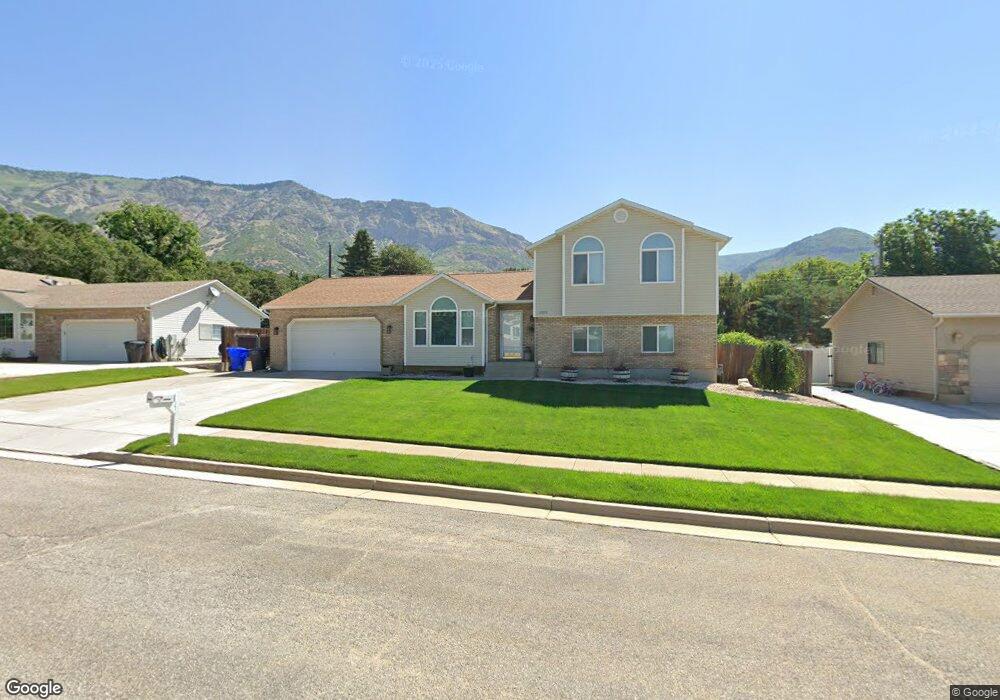
This home is located at 2898 N 875 E, Ogden, UT 84414 and is currently estimated at $528,611, approximately $210 per square foot. 2898 N 875 E is a home located in Weber County with nearby schools including Bates School, North Ogden Junior High School, and Weber High School.
Ownership History
Date
Name
Owned For
Owner Type
Purchase Details
Closed on
Oct 2, 2024
Sold by
Devito Jill and Devito Craig T
Bought by
Stockett Matthew and Stockett Kaylee
Current Estimated Value
Home Financials for this Owner
Home Financials are based on the most recent Mortgage that was taken out on this home.
Original Mortgage
$534,187
Outstanding Balance
$528,687
Interest Rate
6.46%
Mortgage Type
FHA
Estimated Equity
-$76
Purchase Details
Closed on
Jun 6, 2016
Bought by
Devito Jill
Home Financials for this Owner
Home Financials are based on the most recent Mortgage that was taken out on this home.
Original Mortgage
$183,200
Interest Rate
3.66%
Purchase Details
Closed on
Jun 11, 2014
Sold by
Vincent Stanley James and Vincent Leslie Ann
Bought by
Erekson Jill
Home Financials for this Owner
Home Financials are based on the most recent Mortgage that was taken out on this home.
Original Mortgage
$183,350
Interest Rate
4.25%
Mortgage Type
New Conventional
Create a Home Valuation Report for This Property
The Home Valuation Report is an in-depth analysis detailing your home's value as well as a comparison with similar homes in the area
Home Values in the Area
Average Home Value in this Area
Purchase History
| Date | Buyer | Sale Price | Title Company |
|---|---|---|---|
| Stockett Matthew | -- | Stewart Title | |
| Devito Jill | -- | -- | |
| Erekson Jill | -- | Meridian Title Co |
Source: Public Records
Mortgage History
| Date | Status | Borrower | Loan Amount |
|---|---|---|---|
| Open | Stockett Matthew | $534,187 | |
| Previous Owner | Devito Jill | $183,200 | |
| Previous Owner | Devito Jill | -- | |
| Previous Owner | Erekson Jill | $183,350 |
Source: Public Records
Tax History Compared to Growth
Tax History
| Year | Tax Paid | Tax Assessment Tax Assessment Total Assessment is a certain percentage of the fair market value that is determined by local assessors to be the total taxable value of land and additions on the property. | Land | Improvement |
|---|---|---|---|---|
| 2025 | $3,237 | $480,846 | $131,693 | $349,153 |
| 2024 | $3,144 | $260,699 | $72,431 | $188,268 |
| 2023 | $3,118 | $263,450 | $72,417 | $191,033 |
| 2022 | $3,218 | $281,050 | $61,589 | $219,461 |
| 2021 | $2,439 | $359,000 | $62,394 | $296,606 |
| 2020 | $2,213 | $303,000 | $53,058 | $249,942 |
| 2019 | $2,124 | $279,000 | $48,099 | $230,901 |
| 2018 | $1,983 | $248,000 | $48,099 | $199,901 |
| 2017 | $1,879 | $221,000 | $41,240 | $179,760 |
| 2016 | $1,711 | $107,696 | $21,228 | $86,468 |
| 2015 | $1,596 | $99,583 | $18,600 | $80,983 |
| 2014 | $1,479 | $89,613 | $18,600 | $71,013 |
Source: Public Records
Map
Nearby Homes
- 918 E 2850 N
- 2912 N 750 E
- 819 E 2800 N
- 2902 N 700 E
- 2749 N 850 E
- 2795 N 1050 E
- 991 E 3150 N
- 684 E 2700 N
- 2607 N 950 E
- 1396 W Caribou Ct Unit 110
- 1278 W Caribou Ct N Unit 99
- 1376 W Caribou Ct Unit 108
- 1258 W Caribou Ct N Unit 97
- 1340 W Caribou Ct Unit 105
- 1352 W Caribou Ct Unit 106
- 3642 N 800 E
- 1404 W Caribou Ct N Unit 111
- 1384 W Caribou Ct Unit 109
- 779 E 4093 N Unit 40
- 1383 W Caribou Ct